29
/
en
AIzaSyAYiBZKx7MnpbEhh9jyipgxe19OcubqV5w
April 1, 2024
124970
Egypt, Arab Rep.
EGY
true
2
1
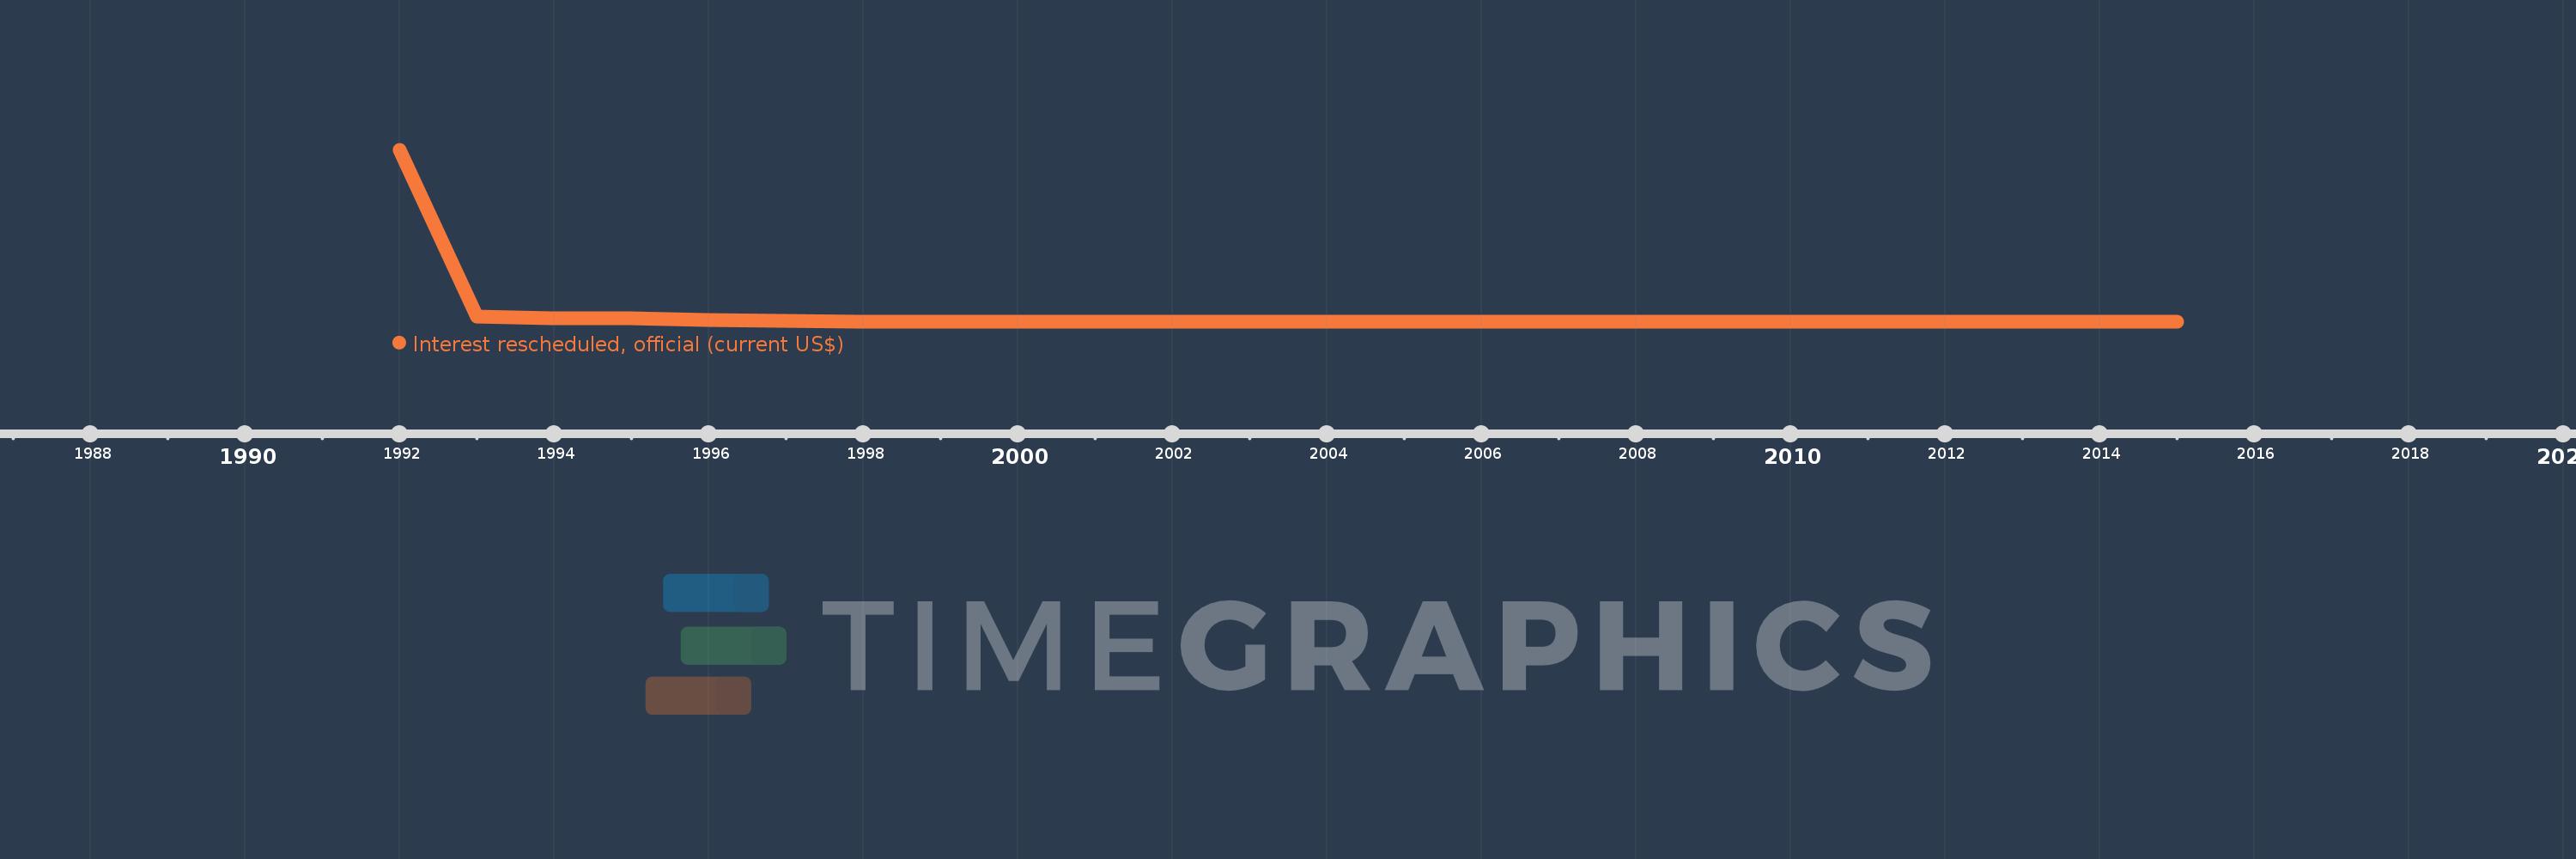
Interest rescheduled, official (current US$)
2015,2008,2007,2006,2005,2004,2003,2002,2001,2000,1999,1998,1997,1996,1995,1994,1993,1992
This statistics in other country:
Timeline:
This timeline shows a graph from 1992 to 2015 of Egypt, Arab Rep.. No data until 1991. Number of actual observations by date: 18.
Source name:
World Development Indicators
Source organization:
World Bank, International Debt Statistics.
Categories, topics:
External Debt
Last updated:
apr 23, 2017
Indicators value changes by year
Maximum:
1.038 bln
jan 1, 1992
At the date of observation
Value
Absolute change
Change from previous value
jan 1, 1992
1.038 bln
+1.038 bln
0.0%
jan 1, 1993
32.641 mln
-1.005 bln
-96.86%
jan 1, 1994
23.228 mln
-9.413 mln
-28.84%
jan 1, 1995
23.294 mln
+66.0K
0.28%
jan 1, 1996
10.237 mln
-13.057 mln
-56.05%
jan 1, 1997
6.196 mln
-4.041 mln
-39.47%
jan 1, 1998
3.291 mln
-2.905 mln
-46.89%
jan 1, 1999
1.726 mln
-1.565 mln
-47.55%
jan 1, 2000
787.0K
-939.0K
-54.4%
jan 1, 2001
223.0K
-564.0K
-71.66%
jan 1, 2002
97.0K
-126.0K
-56.5%
jan 1, 2003
8.0K
-89.0K
-91.75%
jan 1, 2004
7.0K
-1000.0
-12.5%
jan 1, 2005
5.0K
-2.0K
-28.57%
jan 1, 2006
3.0K
-2.0K
-40.0%
jan 1, 2007
1000.0
-2.0K
-66.67%
jan 1, 2008
0.0
-1000.0
-100.0%
Ranking of countries by current statistics by years


Comments: