29
/
en
AIzaSyAYiBZKx7MnpbEhh9jyipgxe19OcubqV5w
April 1, 2024
124749
Egypt, Arab Rep.
EGY
true
2
1
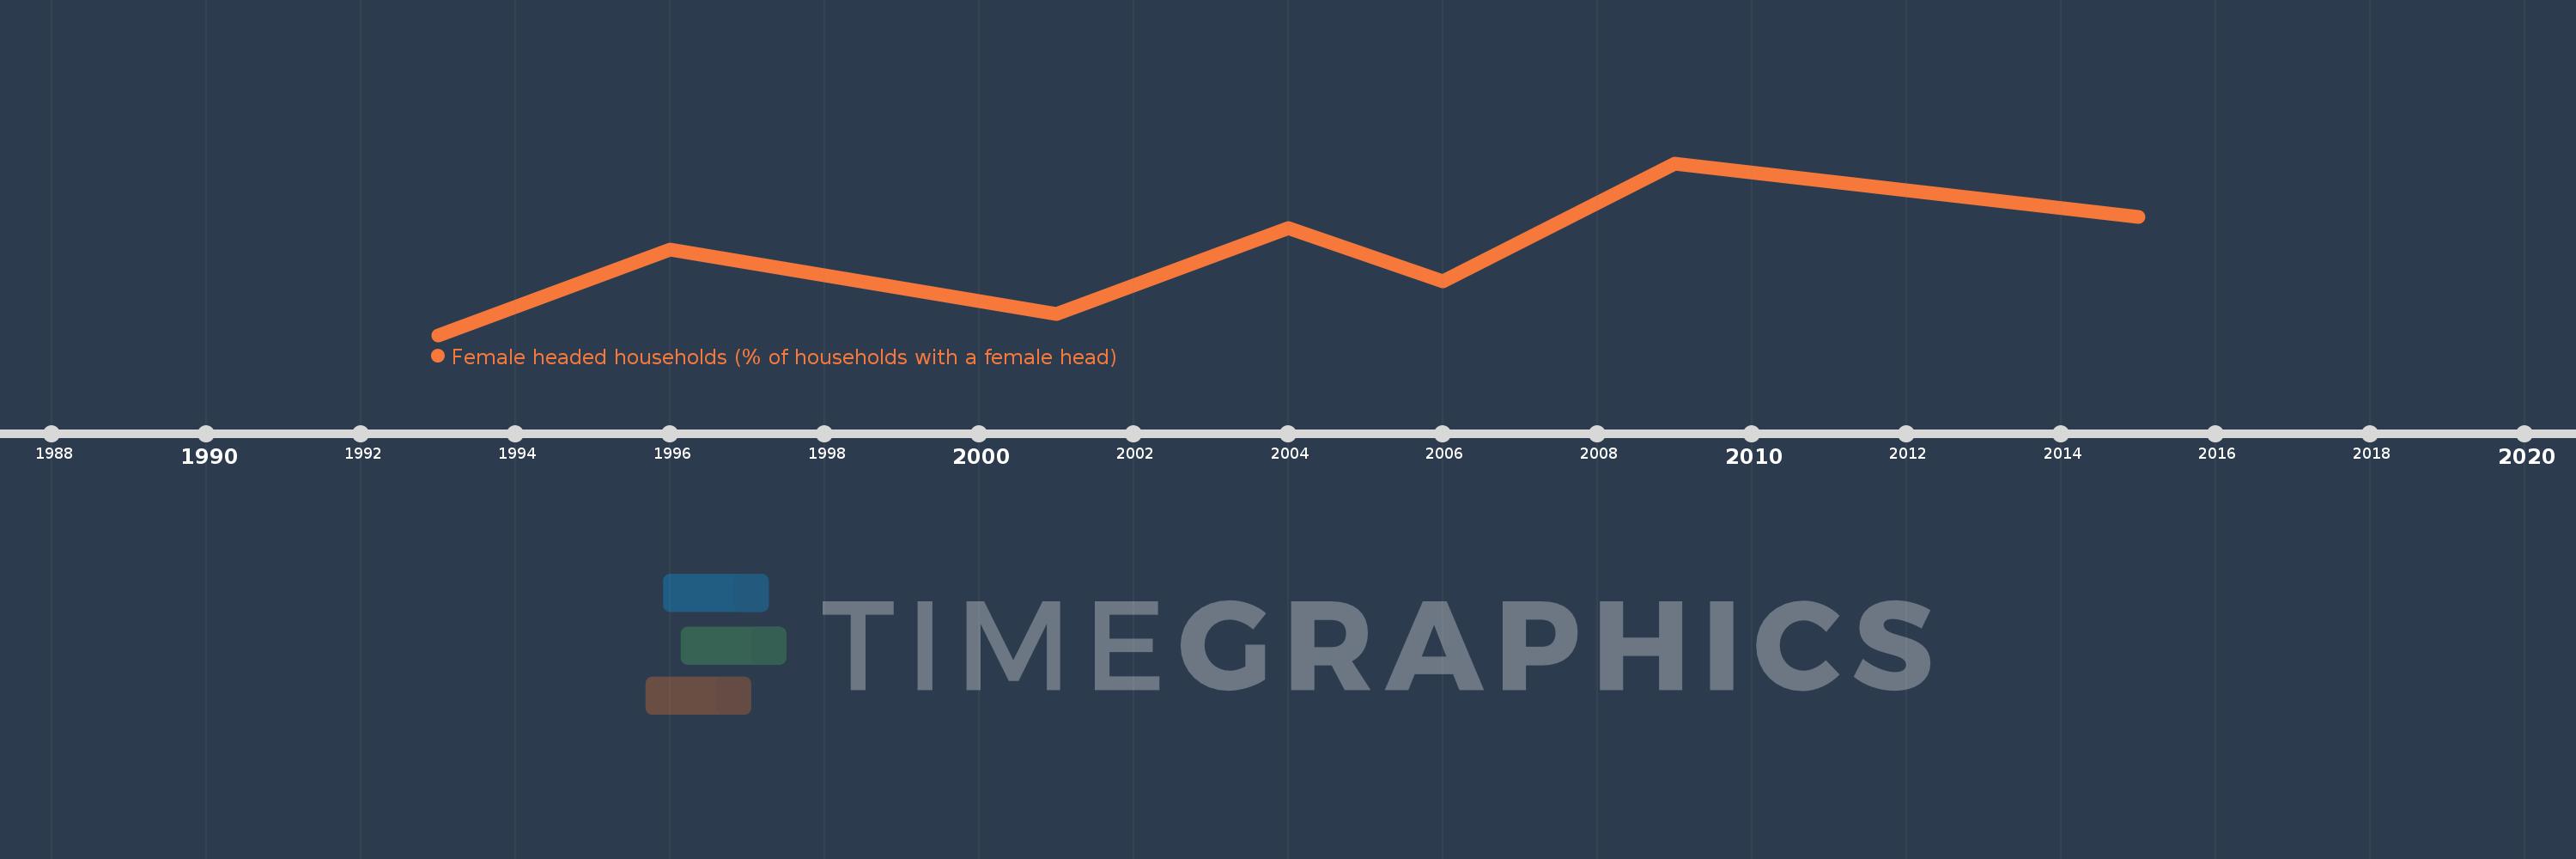
Female headed households (% of households with a female head)
2015,2009,2006,2004,2001,1996,1993
This statistics in other country:
Timeline:
This timeline shows a graph from 1993 to 2015 of Egypt, Arab Rep.. No data until 1992. Number of actual observations by date: 7.
Source name:
World Development Indicators
Source organization:
Demographic and Health Surveys.
Categories, topics:
Health, Gender
Last updated:
apr 23, 2017
Indicators value changes by year
At the date of observation
Value
Absolute change
Change from previous value
jan 1, 1993
11.8
+11.8
0.0%
jan 1, 1996
12.6
+0.8
6.78%
jan 1, 2001
12.0
-0.6
-4.76%
jan 1, 2004
12.8
+0.8
6.67%
jan 1, 2006
12.3
-0.5
-3.91%
jan 1, 2009
13.4
+1.1
8.94%
jan 1, 2015
12.9
-0.5
-3.73%
Ranking of countries by current statistics by years


Comments: