29
/
en
AIzaSyAYiBZKx7MnpbEhh9jyipgxe19OcubqV5w
April 1, 2024
123956
Ecuador
ECU
true
2
1
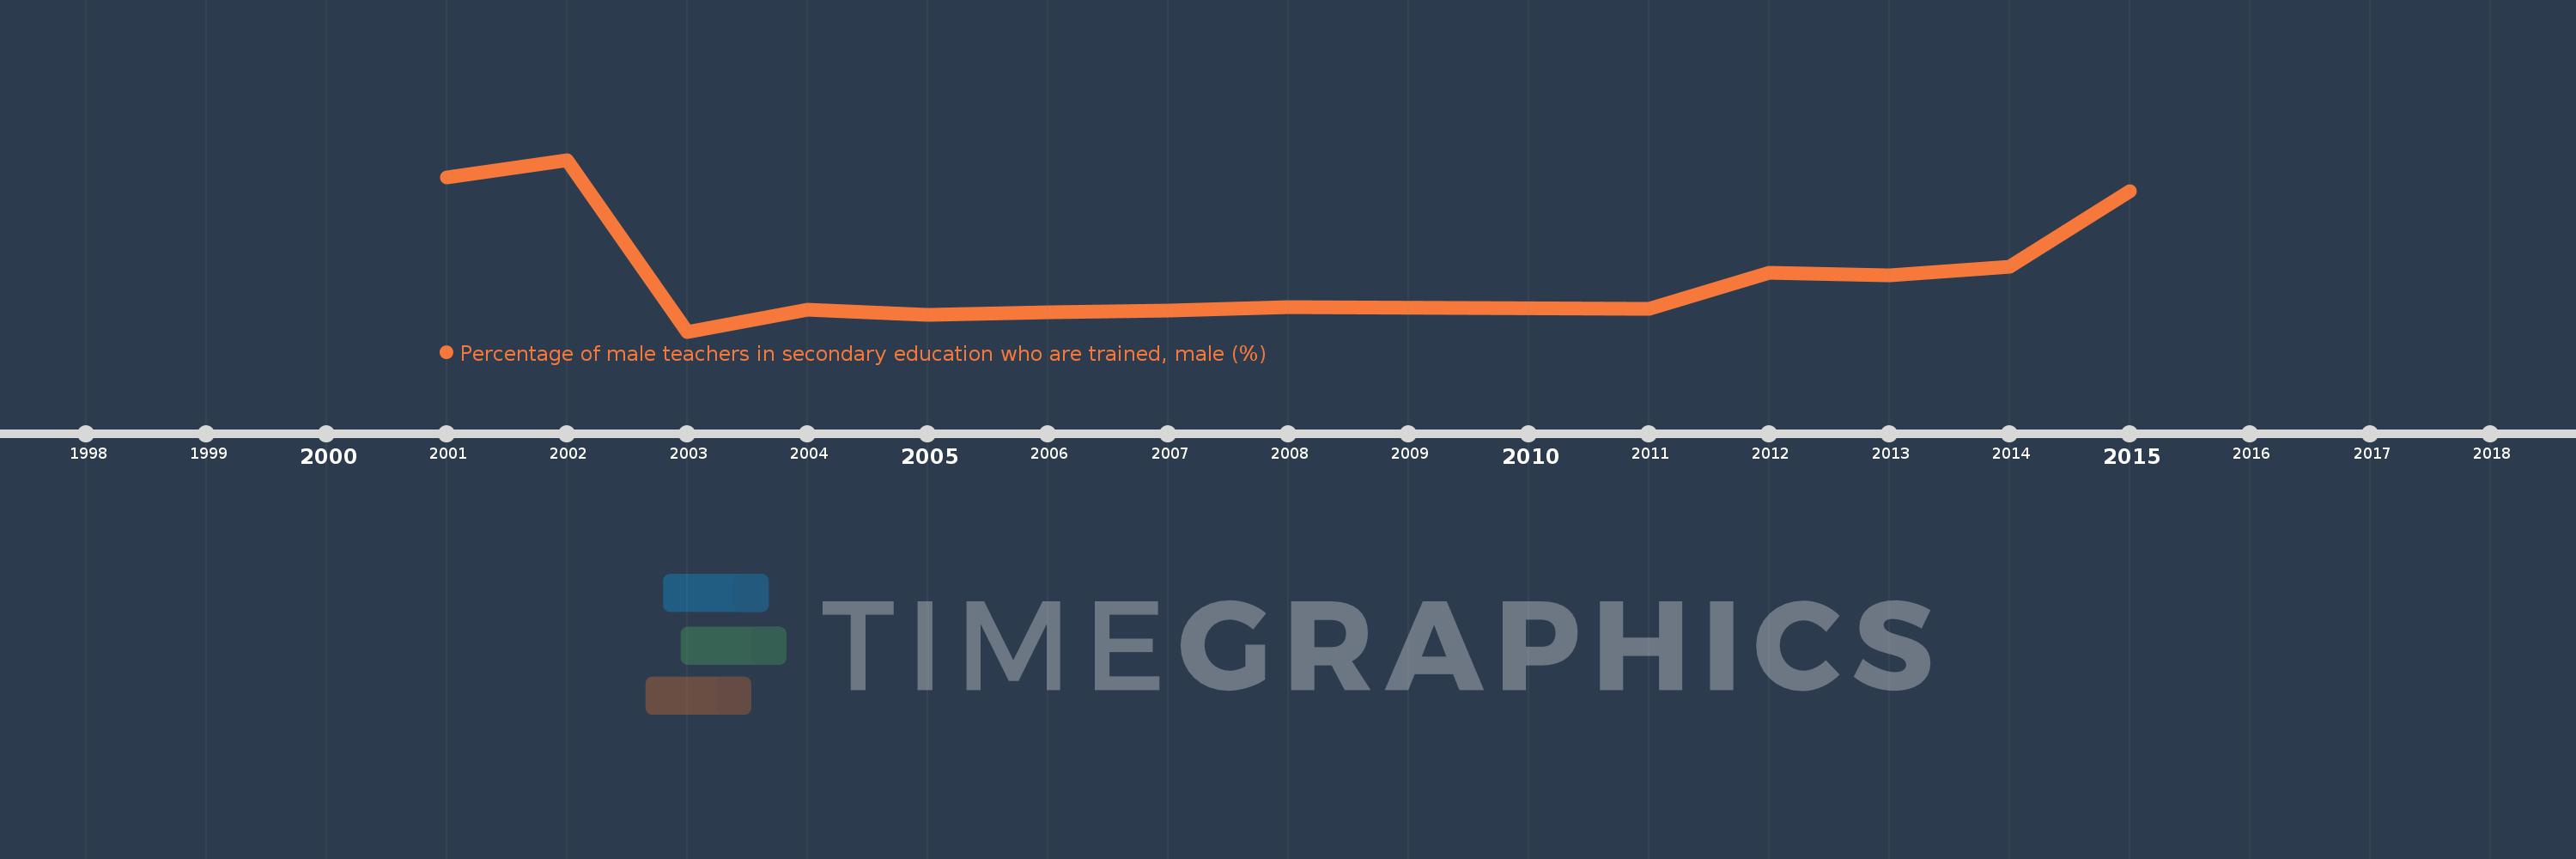
Percentage of male teachers in secondary education who are trained, male (%)
2015,2014,2013,2012,2011,2008,2007,2006,2005,2004,2003,2002,2001
This statistics in other country:
Timeline:
This timeline shows a graph from 2001 to 2015 of Ecuador. No data until 2000. Number of actual observations by date: 13.
Source name:
World Development Indicators
Source organization:
UNESCO Institute for Statistics
Categories, topics:
Education
Last updated:
apr 23, 2017
Indicators value changes by year
Minimum:
60.948
jan 1, 2003
Maximum:
85.301
jan 1, 2002
At the date of observation
Value
Absolute change
Change from previous value
jan 1, 2001
82.765
+82.765
0.0%
jan 1, 2002
85.301
+2.536
3.06%
jan 1, 2003
60.948
-24.353
-28.55%
jan 1, 2004
64.102
+3.154
5.18%
jan 1, 2005
63.343
-0.759
-1.18%
jan 1, 2006
63.717
+0.374
0.59%
jan 1, 2007
63.976
+0.259
0.41%
jan 1, 2008
64.376
+0.4
0.62%
jan 1, 2011
64.206
-0.169
-0.26%
jan 1, 2012
69.3
+5.094
7.93%
jan 1, 2013
68.933
-0.367
-0.53%
jan 1, 2014
70.165
+1.232
1.79%
jan 1, 2015
80.799
+10.634
15.16%
Ranking of countries by current statistics by years


Comments: