29
/
en
AIzaSyAYiBZKx7MnpbEhh9jyipgxe19OcubqV5w
April 1, 2024
123636
Ecuador
ECU
true
2
1
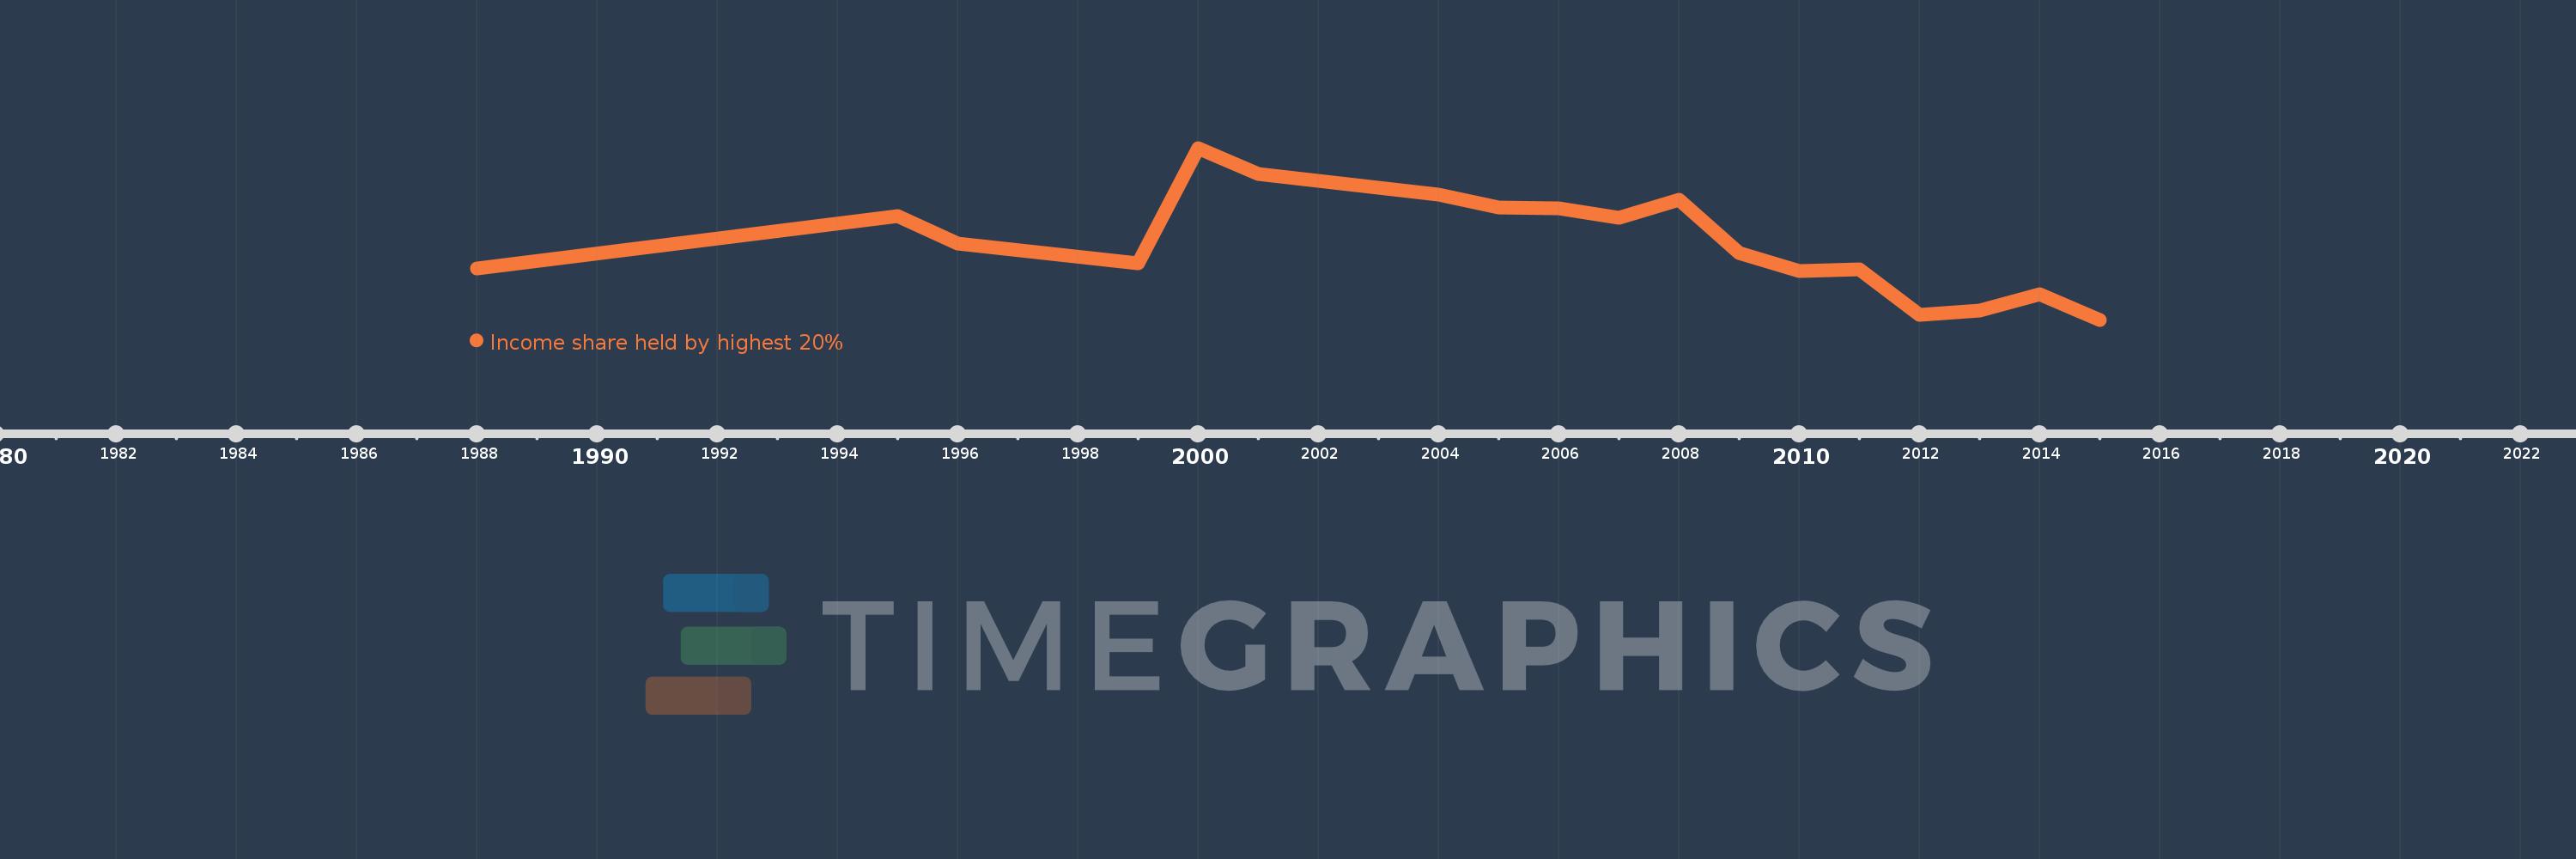
Income share held by highest 20%
2015,2014,2013,2012,2011,2010,2009,2008,2007,2006,2005,2004,2001,2000,1999,1996,1995,1988
This statistics in other country:
Timeline:
This timeline shows a graph from 1988 to 2015 of Ecuador. No data until 1987. Number of actual observations by date: 18.
Source name:
World Development Indicators
Source organization:
World Bank, Development Research Group. Data are based on primary household survey data obtained from government statistical agencies and World Bank country departments. Data for high-income economies are from the Luxembourg Income Study database. For more information and methodology, please see PovcalNet (http://iresearch.worldbank.org/PovcalNet/index.htm).
Categories, topics:
Poverty
Last updated:
apr 23, 2017
Indicators value changes by year
At the date of observation
Value
Absolute change
Change from previous value
jan 1, 1988
54.43
+54.43
0.0%
jan 1, 1995
57.94
+3.51
6.45%
jan 1, 1996
56.09
-1.85
-3.19%
jan 1, 1999
54.77
-1.32
-2.35%
jan 1, 2000
62.46
+7.69
14.04%
jan 1, 2001
60.7
-1.76
-2.82%
jan 1, 2004
59.33
-1.37
-2.26%
jan 1, 2005
58.48
-0.85
-1.43%
jan 1, 2006
58.44
-0.04
-0.07%
jan 1, 2007
57.83
-0.61
-1.04%
jan 1, 2008
58.99
+1.16
2.01%
jan 1, 2009
55.44
-3.55
-6.02%
jan 1, 2010
54.27
-1.17
-2.11%
jan 1, 2011
54.35
+0.08
0.15%
jan 1, 2012
51.34
-3.01
-5.54%
jan 1, 2013
51.59
+0.25
0.49%
jan 1, 2014
52.71
+1.12
2.17%
jan 1, 2015
51.0
-1.71
-3.24%
Ranking of countries by current statistics by years


Comments: