This statistics in other country:
Timeline:
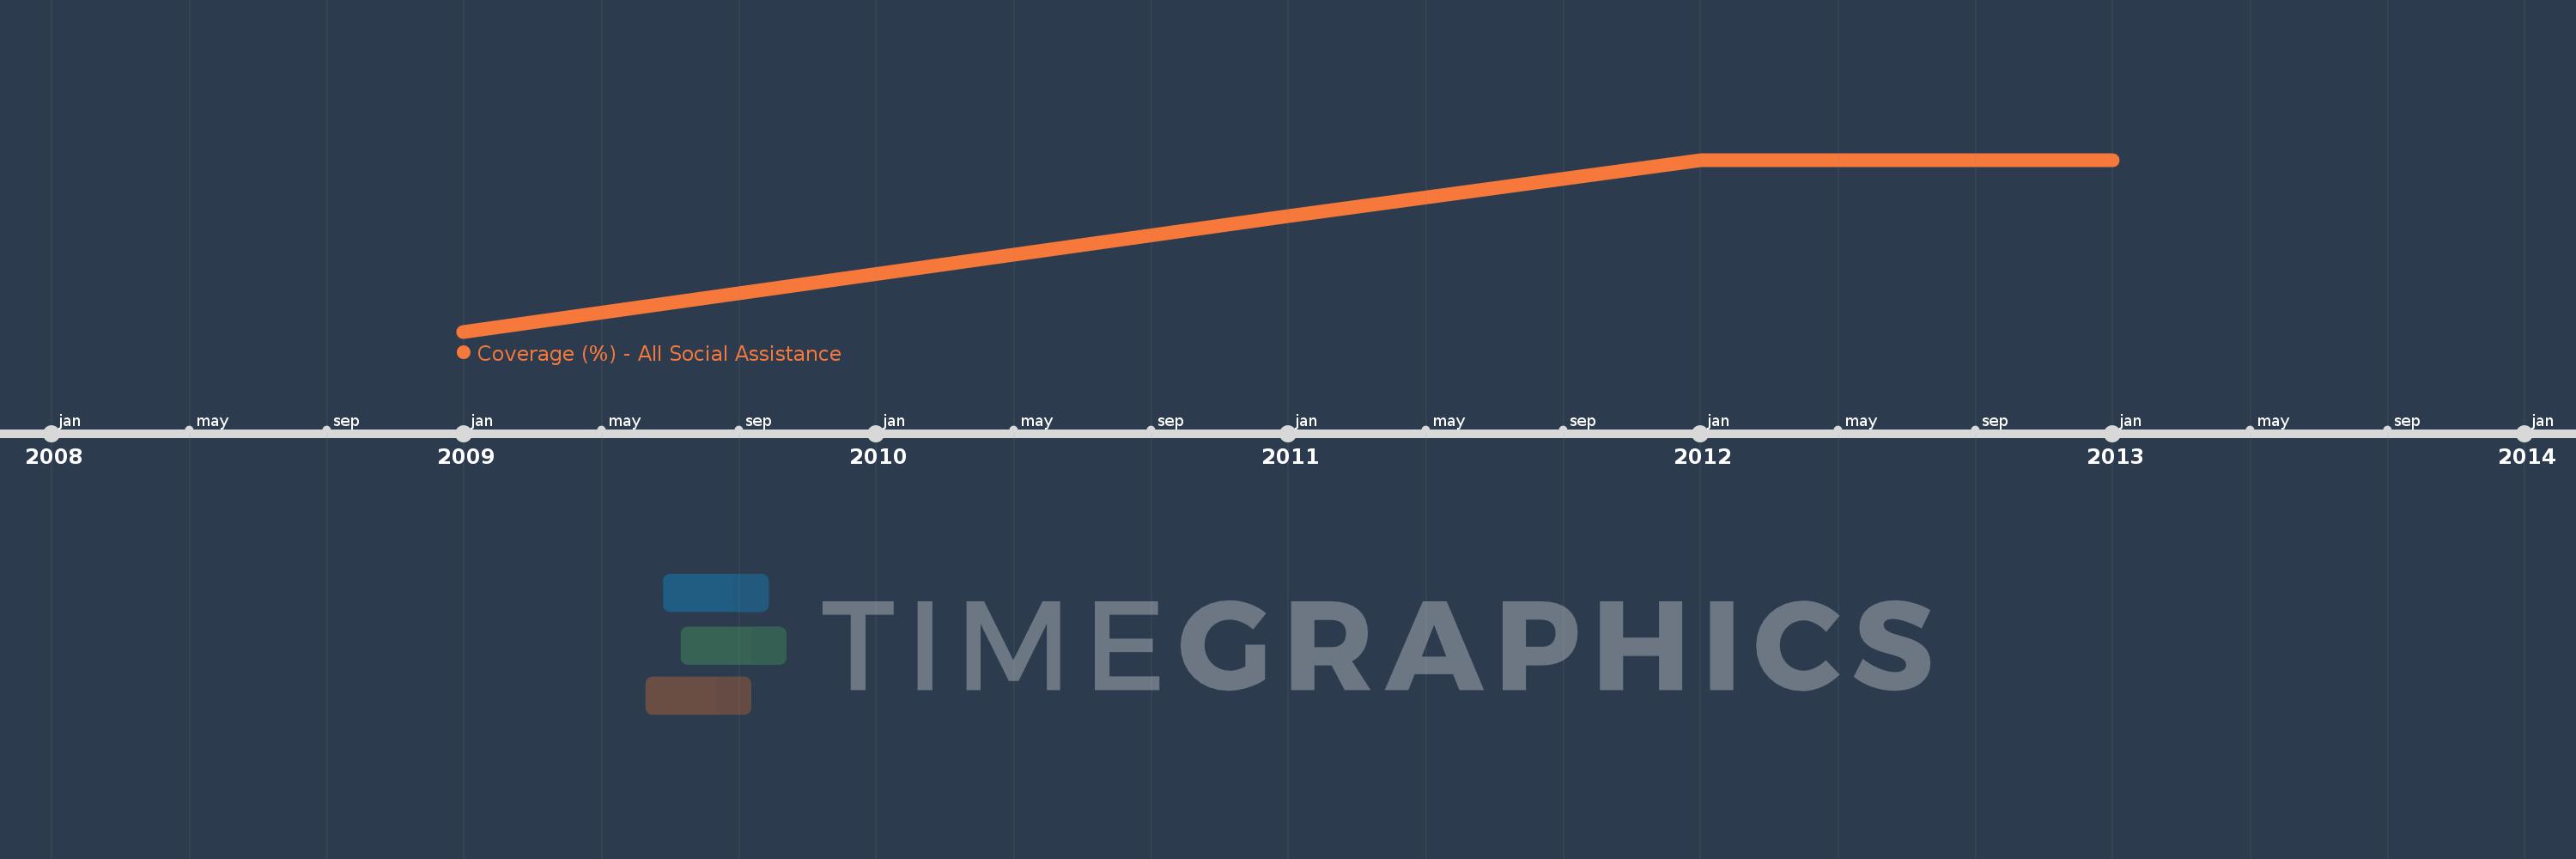
This timeline shows a graph from 2009 to 2013 of Ecuador. No data until 2008. Number of actual observations by date: 4.
Source name:
World Development Indicators
Source organization:
The Atlas of Social Protection: Indicators of Resilience and Equity (ASPIRE)
Categories, topics:
Social Protection & Labor
Last updated:
apr 23, 2017
Indicators value changes by year
Minimum:
57.876
jan 1, 2009
Maximum:
67.988
jan 1, 2012
At the date of observation
Value
Absolute change
Change from previous value
jan 1, 2009
57.876
+57.876
0.0%
jan 1, 2011
64.689
+6.813
11.77%
jan 1, 2012
67.988
+3.299
5.1%
jan 1, 2013
67.988
0.0
0.0%
Ranking of countries by current statistics by years


Comments: