29
/
en
AIzaSyAYiBZKx7MnpbEhh9jyipgxe19OcubqV5w
April 1, 2024
122861
Dominican Republic
DOM
true
2
1
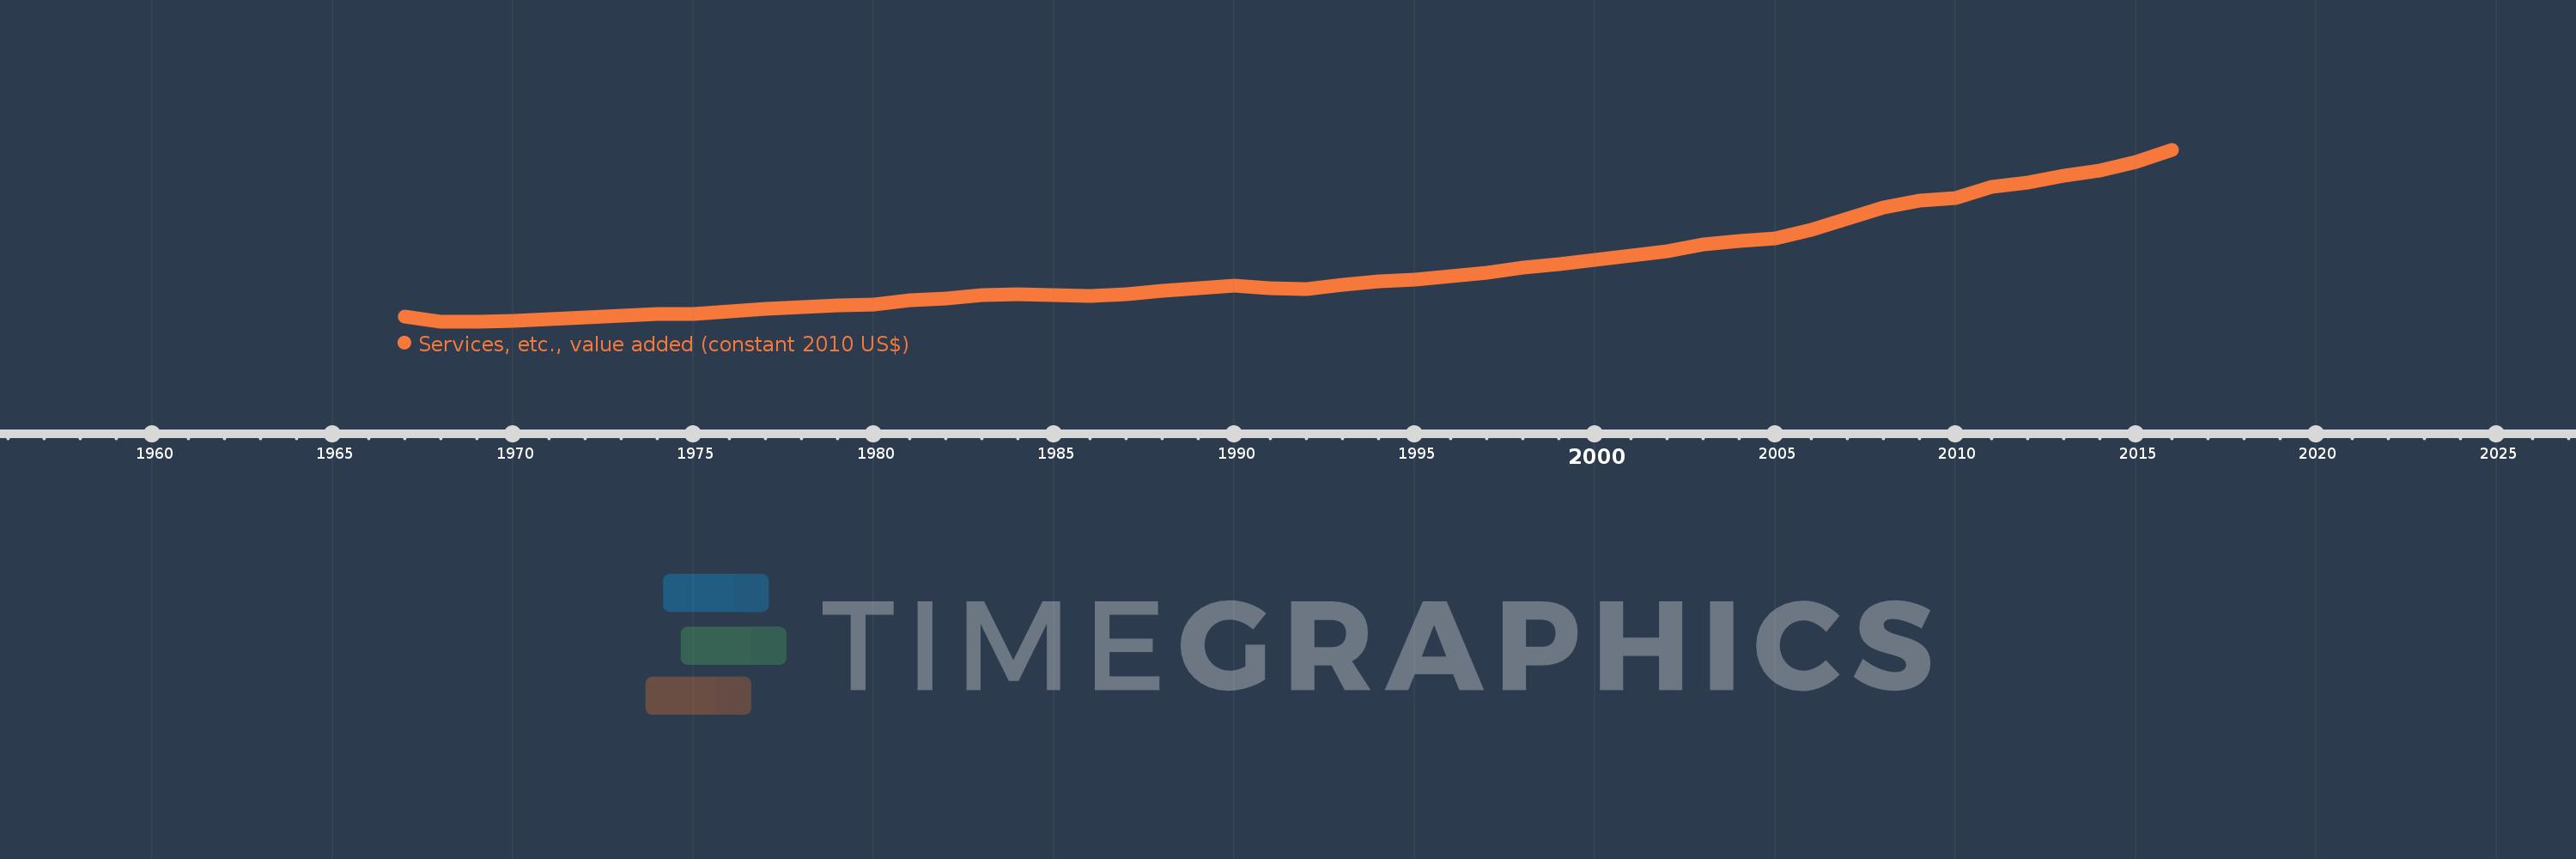
Services, etc., value added (constant 2010 US$)
2016,2015,2014,2013,2012,2011,2010,2009,2008,2007,2006,2005,2004,2003,2002,2001,2000,1999,1998,1997,1996,1995,1994,1993,1992,1991,1990,1989,1988,1987,1986,1985,1984,1983,1982,1981,1980,1979,1978,1977,1976,1975,1974,1973,1972,1971,1970,1969,1968,1967
This statistics in other country:
AfghanistanAlbaniaAlgeriaAndorraAntigua and BarbudaArab WorldArgentinaArmeniaArubaAustraliaAustriaAzerbaijanBahamas, TheBahrainBangladeshBarbadosBelarusBelgiumBelizeBeninBermudaBhutanBoliviaBosnia and HerzegovinaBotswanaBrazilBrunei DarussalamBulgariaBurkina FasoBurundiCabo VerdeCambodiaCameroonCanadaCaribbean small statesCentral African RepublicCentral Europe and the BalticsChadChileChinaColombiaComorosCongo, Dem. Rep.Congo, Rep.Costa RicaCote d'IvoireCroatiaCubaCyprusCzech RepublicDenmarkDominicaDominican RepublicEarly-demographic dividendEast Asia & PacificEast Asia & Pacific (excluding high income)East Asia & Pacific (IDA & IBRD countries)EcuadorEgypt, Arab Rep.El SalvadorEquatorial GuineaEstoniaEthiopiaEuro areaEurope & Central AsiaEurope & Central Asia (excluding high income)Europe & Central Asia (IDA & IBRD countries)European UnionFaroe IslandsFijiFinlandFragile and conflict affected situationsFranceGabonGambia, TheGeorgiaGermanyGhanaGreeceGrenadaGuatemalaGuineaGuinea-BissauGuyanaHeavily indebted poor countries (HIPC)High incomeHondurasHong Kong SAR, ChinaHungaryIBRD onlyIcelandIDA & IBRD totalIDA blendIDA onlyIDA totalIndiaIndonesiaIran, Islamic Rep.IraqIrelandItalyJamaicaJapanJordanKazakhstanKenyaKiribatiKorea, Rep.KosovoKuwaitKyrgyz RepublicLao PDRLate-demographic dividendLatin America & Caribbean Latin America & Caribbean (excluding high income)Latin America & the Caribbean (IDA & IBRD countries)LatviaLeast developed countries: UN classificationLebanonLesothoLiberiaLithuaniaLow & middle incomeLow incomeLower middle incomeLuxembourgMacao SAR, ChinaMacedonia, FYRMadagascarMalawiMalaysiaMaldivesMaliMaltaMarshall IslandsMauritaniaMauritiusMexicoMicronesia, Fed. Sts.Middle East & North AfricaMiddle East & North Africa (excluding high income)Middle East & North Africa (IDA & IBRD countries)Middle incomeMoldovaMongoliaMontenegroMoroccoMozambiqueMyanmarNamibiaNepalNetherlandsNew ZealandNicaraguaNigerNigeriaNorth AmericaNorwayOECD membersOmanOther small statesPacific island small statesPakistanPalauPanamaParaguayPeruPhilippinesPolandPortugalPost-demographic dividendPre-demographic dividendPuerto RicoQatarRomaniaRussian FederationRwandaSamoaSao Tome and PrincipeSaudi ArabiaSenegalSerbiaSeychellesSierra LeoneSingaporeSlovak RepublicSloveniaSmall statesSouth AfricaSouth AsiaSouth Asia (IDA & IBRD)SpainSri LankaSt. Kitts and NevisSt. LuciaSt. Vincent and the GrenadinesSub-Saharan Africa Sub-Saharan Africa (excluding high income)Sub-Saharan Africa (IDA & IBRD countries)SudanSurinameSwazilandSwedenSwitzerlandTajikistanTanzaniaThailandTimor-LesteTogoTongaTrinidad and TobagoTunisiaTurkeyTurkmenistanTuvaluUgandaUkraineUnited Arab EmiratesUnited KingdomUnited StatesUpper middle incomeUruguayUzbekistanVanuatuVenezuela, RBVietnamWest Bank and GazaWorldYemen, Rep.ZambiaZimbabwe Timeline:
This timeline shows a graph from 1967 to 2016 of Dominican Republic. No data until 1966. Number of actual observations by date: 50.
Source name:
World Development Indicators
Source organization:
World Bank national accounts data, and OECD National Accounts data files.
Categories, topics:
Economy & Growth
Last updated:
apr 23, 2017
Indicators value changes by year
Minimum:
2.9 bln
jan 1, 1969
Maximum:
41.369 bln
jan 1, 2016
At the date of observation
Value
Absolute change
Change from previous value
jan 1, 1967
4.027 bln
+4.027 bln
0.0%
jan 1, 1968
2.908 bln
-1.12 bln
-27.8%
jan 1, 1969
2.9 bln
-7.319 mln
-0.25%
jan 1, 1970
3.093 bln
+192.446 mln
6.64%
jan 1, 1971
3.601 bln
+508.215 mln
16.43%
jan 1, 1972
3.911 bln
+310.03 mln
8.61%
jan 1, 1973
4.304 bln
+393.363 mln
10.06%
jan 1, 1974
4.746 bln
+441.041 mln
10.25%
jan 1, 1975
4.694 bln
-51.481 mln
-1.08%
jan 1, 1976
5.196 bln
+501.898 mln
10.69%
jan 1, 1977
5.82 bln
+624.273 mln
12.01%
jan 1, 1978
6.133 bln
+312.702 mln
5.37%
jan 1, 1979
6.669 bln
+536.558 mln
8.75%
jan 1, 1980
6.9 bln
+230.77 mln
3.46%
jan 1, 1981
7.848 bln
+947.37 mln
13.73%
jan 1, 1982
8.247 bln
+399.13 mln
5.09%
jan 1, 1983
8.97 bln
+723.059 mln
8.77%
jan 1, 1984
9.02 bln
+50.516 mln
0.56%
jan 1, 1985
8.995 bln
-25.048 mln
-0.28%
jan 1, 1986
8.769 bln
-226.68 mln
-2.52%
jan 1, 1987
9.024 bln
+255.216 mln
2.91%
jan 1, 1988
9.973 bln
+949.16 mln
10.52%
jan 1, 1989
10.504 bln
+530.629 mln
5.32%
jan 1, 1990
10.943 bln
+439.48 mln
4.18%
jan 1, 1991
10.432 bln
-511.347 mln
-4.67%
jan 1, 1992
10.333 bln
-98.397 mln
-0.94%
jan 1, 1993
11.223 bln
+890.13 mln
8.61%
jan 1, 1994
12.038 bln
+814.275 mln
7.26%
jan 1, 1995
12.429 bln
+391.44 mln
3.25%
jan 1, 1996
13.22 bln
+790.908 mln
6.36%
jan 1, 1997
13.985 bln
+764.96 mln
5.79%
jan 1, 1998
15.013 bln
+1.027 bln
7.35%
jan 1, 1999
15.788 bln
+775.425 mln
5.17%
jan 1, 2000
16.858 bln
+1.07 bln
6.78%
jan 1, 2001
17.761 bln
+903.498 mln
5.36%
jan 1, 2002
18.804 bln
+1.043 bln
5.87%
jan 1, 2003
20.207 bln
+1.403 bln
7.46%
jan 1, 2004
21.021 bln
+814.67 mln
4.03%
jan 1, 2005
21.588 bln
+566.803 mln
2.7%
jan 1, 2006
23.495 bln
+1.906 bln
8.83%
jan 1, 2007
26.044 bln
+2.549 bln
10.85%
jan 1, 2008
28.577 bln
+2.533 bln
9.73%
jan 1, 2009
30.062 bln
+1.485 bln
5.2%
jan 1, 2010
30.739 bln
+676.507 mln
2.25%
jan 1, 2011
33.156 bln
+2.417 bln
7.86%
jan 1, 2012
34.152 bln
+996.415 mln
3.01%
jan 1, 2013
35.664 bln
+1.512 bln
4.43%
jan 1, 2014
36.79 bln
+1.126 bln
3.16%
jan 1, 2015
38.827 bln
+2.037 bln
5.54%
jan 1, 2016
41.369 bln
+2.542 bln
6.55%
Ranking of countries by current statistics by years


Comments: