29
/
en
AIzaSyAYiBZKx7MnpbEhh9jyipgxe19OcubqV5w
April 1, 2024
121384
Dominica
DMA
true
2
1
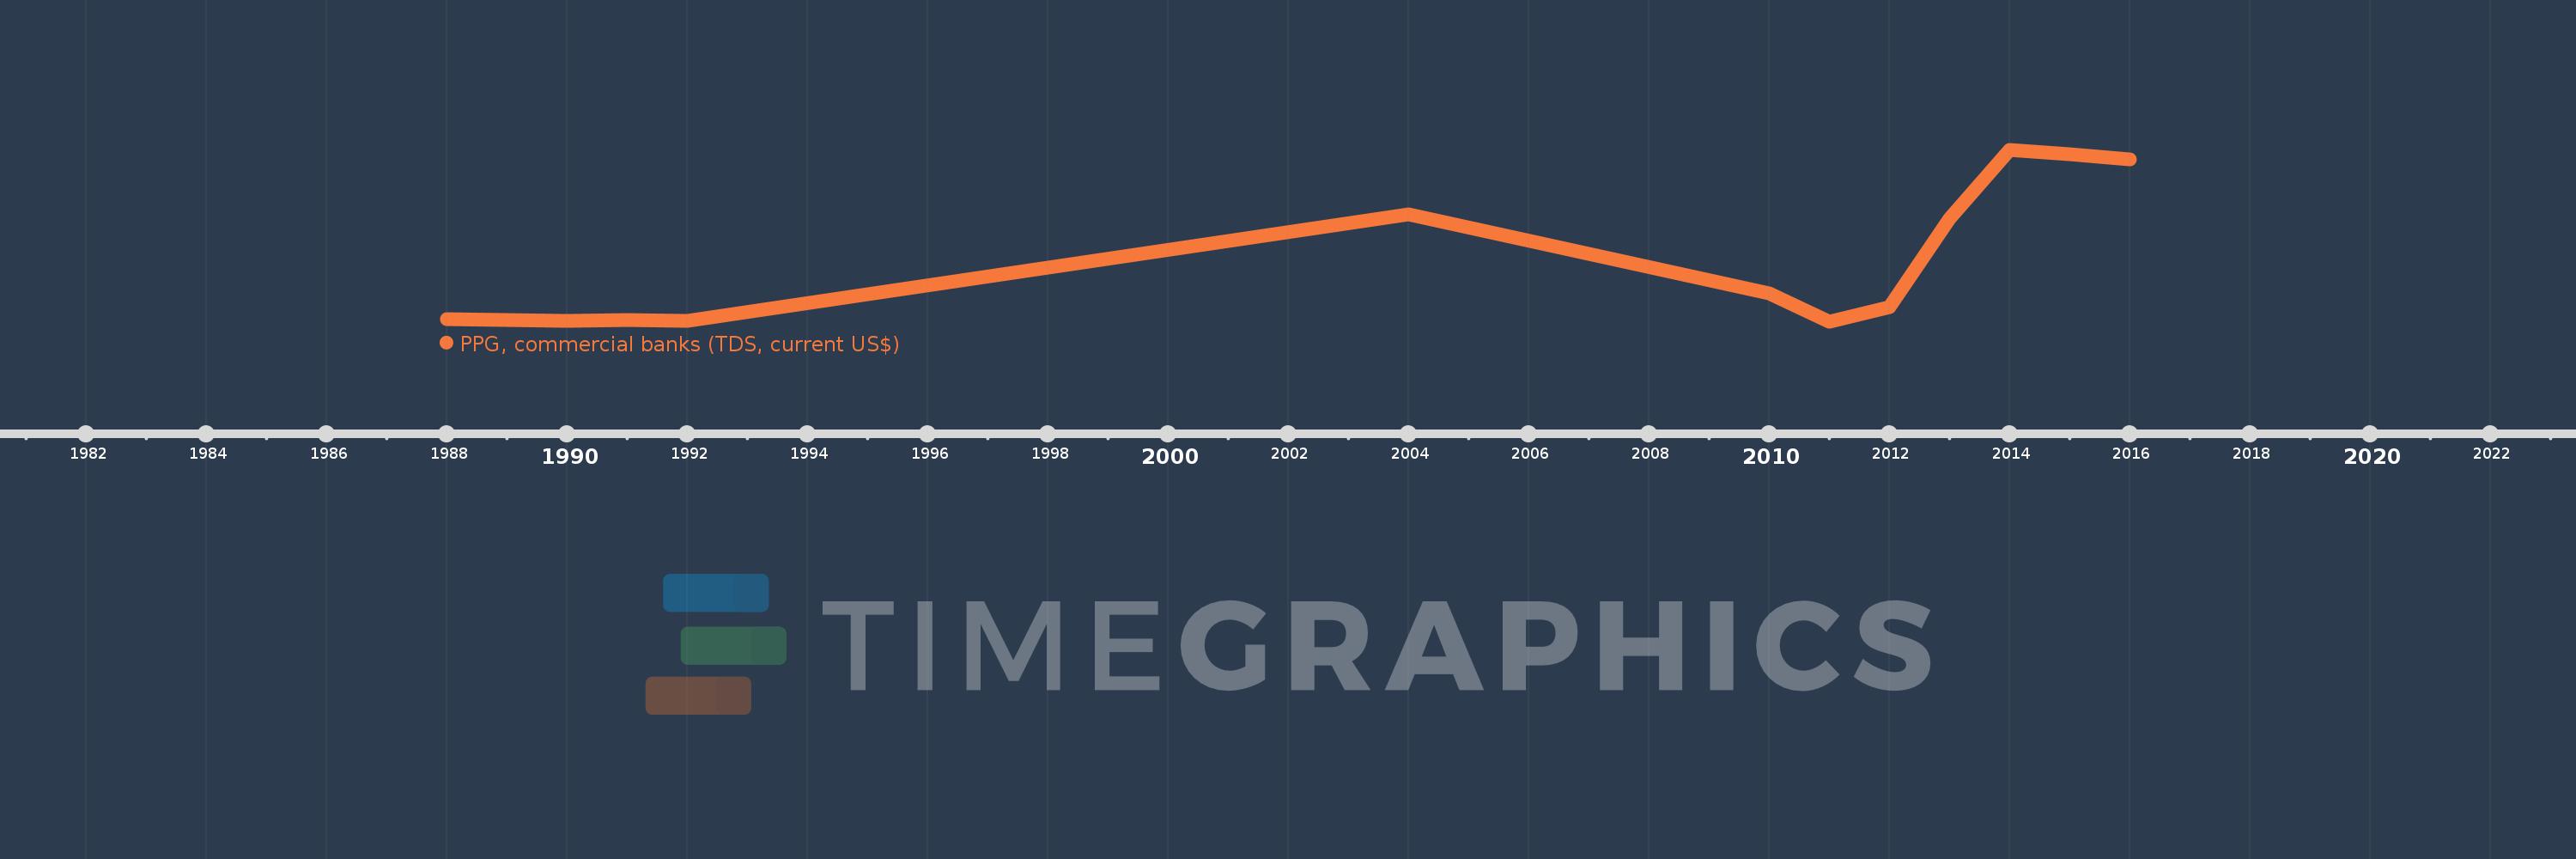
PPG, commercial banks (TDS, current US$)
2016,2015,2014,2013,2012,2011,2010,2004,1992,1991,1990,1989,1988
This statistics in other country:
Timeline:
This timeline shows a graph from 1988 to 2016 of Dominica. No data until 1987. Number of actual observations by date: 13.
Source name:
World Development Indicators
Source organization:
World Bank, International Debt Statistics.
Categories, topics:
External Debt
Last updated:
apr 23, 2017
Indicators value changes by year
Maximum:
1.746 mln
jan 1, 2014
At the date of observation
Value
Absolute change
Change from previous value
jan 1, 1988
92.0K
+92.0K
0.0%
jan 1, 1989
87.0K
-5.0K
-5.43%
jan 1, 1990
76.0K
-11.0K
-12.64%
jan 1, 1991
84.0K
+8.0K
10.53%
jan 1, 1992
76.0K
-8.0K
-9.52%
jan 1, 2004
1.12 mln
+1.044 mln
1.37K%
jan 1, 2010
342.0K
-778.0K
-69.46%
jan 1, 2011
65.0K
-277.0K
-80.99%
jan 1, 2012
212.0K
+147.0K
226.15%
jan 1, 2013
1.076 mln
+864.0K
407.55%
jan 1, 2014
1.746 mln
+670.0K
62.27%
jan 1, 2015
1.704 mln
-42.0K
-2.41%
jan 1, 2016
1.66 mln
-44.0K
-2.58%
Ranking of countries by current statistics by years


Comments: