29
/
en
AIzaSyAYiBZKx7MnpbEhh9jyipgxe19OcubqV5w
April 1, 2024
117920
Czech Republic
CZE
true
2
1
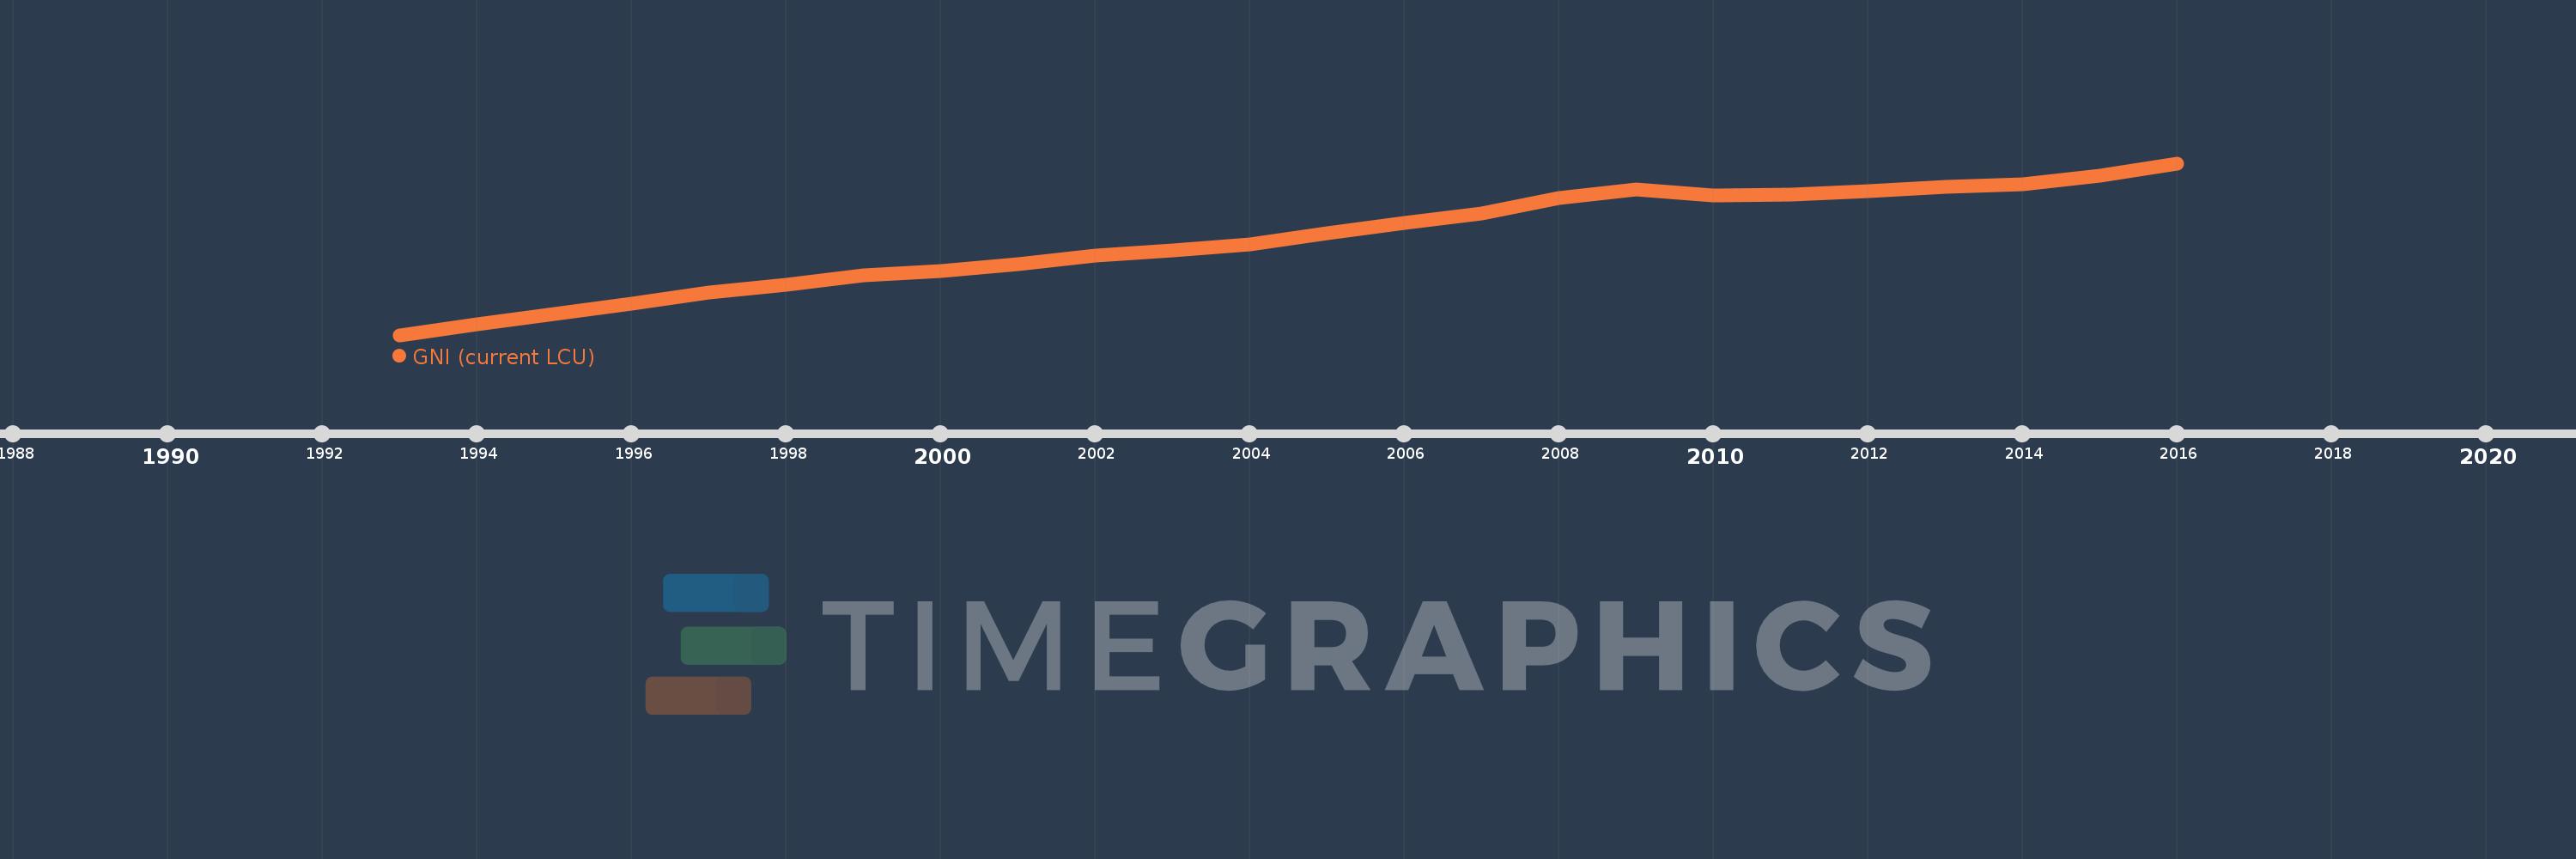
GNI (current LCU)
2016,2015,2014,2013,2012,2011,2010,2009,2008,2007,2006,2005,2004,2003,2002,2001,2000,1999,1998,1997,1996,1995,1994,1993
This statistics in other country:
AfghanistanAlbaniaAlgeriaAmerican SamoaAndorraAngolaAntigua and BarbudaArgentinaArmeniaAustraliaAustriaAzerbaijanBahamas, TheBahrainBangladeshBarbadosBelarusBelgiumBelizeBeninBermudaBhutanBoliviaBosnia and HerzegovinaBotswanaBrazilBrunei DarussalamBulgariaBurkina FasoBurundiCabo VerdeCambodiaCameroonCanadaCentral African RepublicChadChannel IslandsChileChinaColombiaComorosCongo, Dem. Rep.Congo, Rep.Costa RicaCote d'IvoireCroatiaCubaCyprusCzech RepublicDenmarkDjiboutiDominicaDominican RepublicEcuadorEgypt, Arab Rep.El SalvadorEquatorial GuineaEritreaEstoniaEthiopiaFaroe IslandsFijiFinlandFranceFrench PolynesiaGabonGambia, TheGeorgiaGermanyGhanaGreeceGreenlandGrenadaGuamGuatemalaGuineaGuinea-BissauGuyanaHaitiHondurasHong Kong SAR, ChinaHungaryIcelandIndiaIndonesiaIran, Islamic Rep.IraqIrelandIsle of ManIsraelItalyJamaicaJapanJordanKazakhstanKenyaKiribatiKorea, Rep.KosovoKuwaitKyrgyz RepublicLao PDRLatviaLebanonLesothoLiberiaLibyaLiechtensteinLithuaniaLuxembourgMacao SAR, ChinaMacedonia, FYRMadagascarMalawiMalaysiaMaldivesMaliMaltaMarshall IslandsMauritaniaMauritiusMexicoMicronesia, Fed. Sts.MoldovaMonacoMongoliaMontenegroMoroccoMozambiqueMyanmarNamibiaNauruNepalNetherlandsNew CaledoniaNew ZealandNicaraguaNigerNigeriaNorwayOmanPakistanPalauPanamaPapua New GuineaParaguayPeruPhilippinesPolandPortugalPuerto RicoQatarRomaniaRussian FederationRwandaSamoaSan MarinoSao Tome and PrincipeSaudi ArabiaSenegalSerbiaSeychellesSierra LeoneSingaporeSlovak RepublicSloveniaSolomon IslandsSomaliaSouth AfricaSouth SudanSpainSri LankaSt. Kitts and NevisSt. LuciaSt. Vincent and the GrenadinesSudanSurinameSwazilandSwedenSwitzerlandSyrian Arab RepublicTajikistanTanzaniaThailandTimor-LesteTogoTongaTrinidad and TobagoTunisiaTurkeyTurkmenistanTuvaluUgandaUkraineUnited Arab EmiratesUnited KingdomUnited StatesUruguayUzbekistanVanuatuVenezuela, RBVietnamVirgin Islands (U.S.)West Bank and GazaYemen, Rep.ZambiaZimbabwe Timeline:
This timeline shows a graph from 1993 to 2016 of Czech Republic. No data until 1992. Number of actual observations by date: 24.
Source name:
World Development Indicators
Source organization:
World Bank national accounts data, and OECD National Accounts data files.
Categories, topics:
Economy & Growth
Last updated:
apr 23, 2017
Indicators value changes by year
Minimum:
968.382 bln
jan 1, 1993
Maximum:
4.255 trl
jan 1, 2016
At the date of observation
Value
Absolute change
Change from previous value
jan 1, 1993
968.382 bln
+968.382 bln
0.0%
jan 1, 1994
1.181 trl
+212.466 bln
21.94%
jan 1, 1995
1.365 trl
+184.356 bln
15.61%
jan 1, 1996
1.569 trl
+203.301 bln
14.89%
jan 1, 1997
1.788 trl
+219.995 bln
14.03%
jan 1, 1998
1.928 trl
+139.681 bln
7.81%
jan 1, 1999
2.114 trl
+185.688 bln
9.63%
jan 1, 2000
2.198 trl
+84.461 bln
4.0%
jan 1, 2001
2.329 trl
+130.773 bln
5.95%
jan 1, 2002
2.493 trl
+163.672 bln
7.03%
jan 1, 2003
2.582 trl
+88.922 bln
3.57%
jan 1, 2004
2.708 trl
+126.442 bln
4.9%
jan 1, 2005
2.917 trl
+208.719 bln
7.71%
jan 1, 2006
3.111 trl
+193.785 bln
6.64%
jan 1, 2007
3.294 trl
+183.679 bln
5.9%
jan 1, 2008
3.587 trl
+292.355 bln
8.87%
jan 1, 2009
3.755 trl
+168.117 bln
4.69%
jan 1, 2010
3.646 trl
-109.084 bln
-2.91%
jan 1, 2011
3.656 trl
+10.548 bln
0.29%
jan 1, 2012
3.728 trl
+72.024 bln
1.97%
jan 1, 2013
3.808 trl
+80.06 bln
2.15%
jan 1, 2014
3.854 trl
+45.179 bln
1.19%
jan 1, 2015
4.022 trl
+168.757 bln
4.38%
jan 1, 2016
4.255 trl
+232.969 bln
5.79%
Ranking of countries by current statistics by years


Comments: