29
/
en
AIzaSyAYiBZKx7MnpbEhh9jyipgxe19OcubqV5w
April 1, 2024
117323
Cyprus
CYP
true
2
1
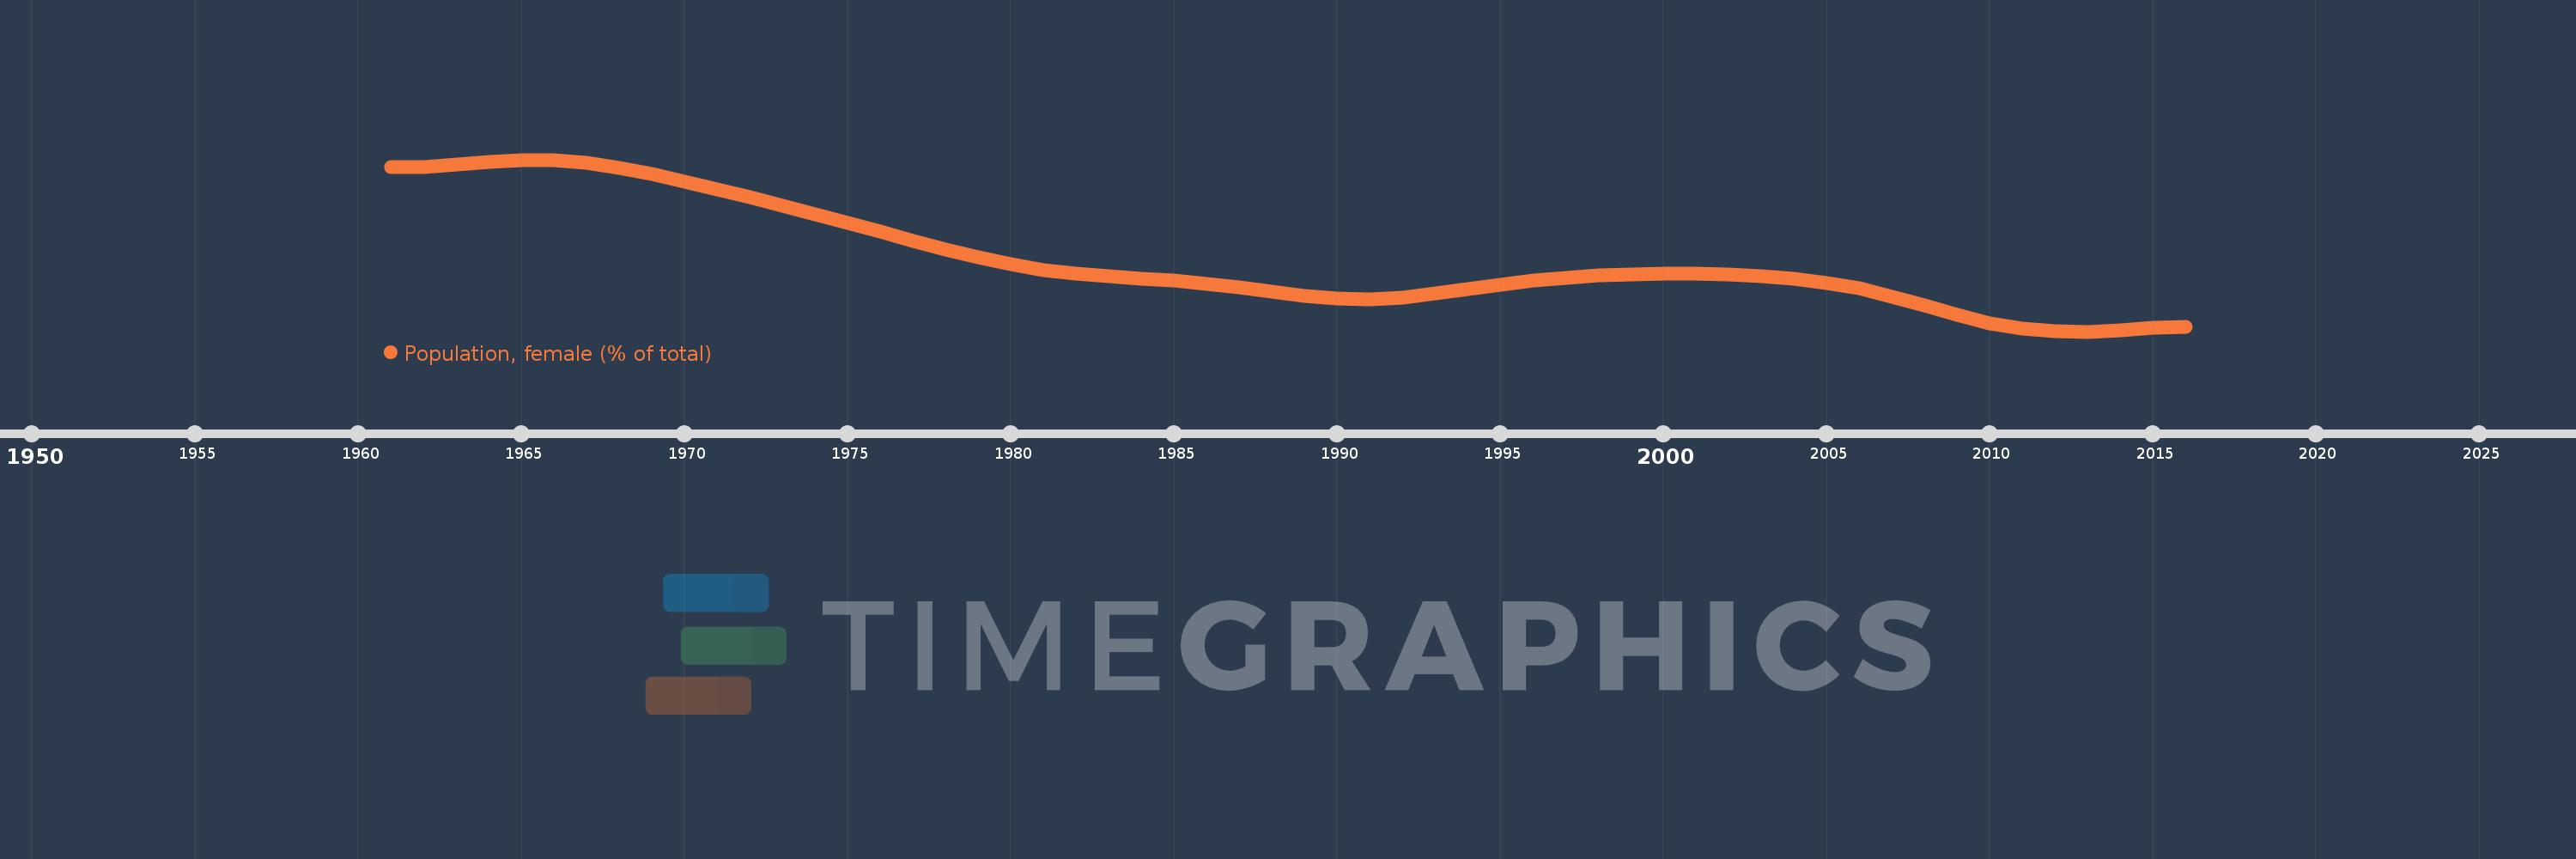
Population, female (% of total)
2016,2015,2014,2013,2012,2011,2010,2009,2008,2007,2006,2005,2004,2003,2002,2001,2000,1999,1998,1997,1996,1995,1994,1993,1992,1991,1990,1989,1988,1987,1986,1985,1984,1983,1982,1981,1980,1979,1978,1977,1976,1975,1974,1973,1972,1971,1970,1969,1968,1967,1966,1965,1964,1963,1962,1961
This statistics in other country:
AfghanistanAlbaniaAlgeriaAngolaAntigua and BarbudaArab WorldArgentinaArmeniaArubaAustraliaAustriaAzerbaijanBahamas, TheBahrainBangladeshBarbadosBelarusBelgiumBelizeBeninBhutanBoliviaBosnia and HerzegovinaBotswanaBrazilBrunei DarussalamBulgariaBurkina FasoBurundiCabo VerdeCambodiaCameroonCanadaCaribbean small statesCentral African RepublicCentral Europe and the BalticsChadChannel IslandsChileChinaColombiaComorosCongo, Dem. Rep.Congo, Rep.Costa RicaCote d'IvoireCroatiaCubaCuracaoCyprusCzech RepublicDenmarkDjiboutiDominican RepublicEarly-demographic dividendEast Asia & PacificEast Asia & Pacific (excluding high income)East Asia & Pacific (IDA & IBRD countries)EcuadorEgypt, Arab Rep.El SalvadorEquatorial GuineaEritreaEstoniaEthiopiaEuro areaEurope & Central AsiaEurope & Central Asia (excluding high income)Europe & Central Asia (IDA & IBRD countries)European UnionFijiFinlandFragile and conflict affected situationsFranceFrench PolynesiaGabonGambia, TheGeorgiaGermanyGhanaGreeceGrenadaGuamGuatemalaGuineaGuinea-BissauGuyanaHaitiHeavily indebted poor countries (HIPC)High incomeHondurasHong Kong SAR, ChinaHungaryIBRD onlyIcelandIDA & IBRD totalIDA blendIDA onlyIDA totalIndiaIndonesiaIran, Islamic Rep.IraqIrelandIsraelItalyJamaicaJapanJordanKazakhstanKenyaKiribatiKorea, Dem. People’s Rep.Korea, Rep.KosovoKuwaitKyrgyz RepublicLao PDRLate-demographic dividendLatin America & Caribbean Latin America & Caribbean (excluding high income)Latin America & the Caribbean (IDA & IBRD countries)LatviaLeast developed countries: UN classificationLebanonLesothoLiberiaLibyaLithuaniaLow & middle incomeLow incomeLower middle incomeLuxembourgMacao SAR, ChinaMacedonia, FYRMadagascarMalawiMalaysiaMaldivesMaliMaltaMauritaniaMauritiusMexicoMicronesia, Fed. Sts.Middle East & North AfricaMiddle East & North Africa (excluding high income)Middle East & North Africa (IDA & IBRD countries)Middle incomeMoldovaMongoliaMontenegroMoroccoMozambiqueMyanmarNamibiaNepalNetherlandsNew CaledoniaNew ZealandNicaraguaNigerNigeriaNorth AmericaNorwayOECD membersOmanOther small statesPacific island small statesPakistanPanamaPapua New GuineaParaguayPeruPhilippinesPolandPortugalPost-demographic dividendPre-demographic dividendPuerto RicoQatarRomaniaRussian FederationRwandaSamoaSao Tome and PrincipeSaudi ArabiaSenegalSerbiaSeychellesSierra LeoneSingaporeSlovak RepublicSloveniaSmall statesSolomon IslandsSomaliaSouth AfricaSouth AsiaSouth Asia (IDA & IBRD)South SudanSpainSri LankaSt. LuciaSt. Vincent and the GrenadinesSub-Saharan Africa Sub-Saharan Africa (excluding high income)Sub-Saharan Africa (IDA & IBRD countries)SudanSurinameSwazilandSwedenSwitzerlandSyrian Arab RepublicTajikistanTanzaniaThailandTimor-LesteTogoTongaTrinidad and TobagoTunisiaTurkeyTurkmenistanUgandaUkraineUnited Arab EmiratesUnited KingdomUnited StatesUpper middle incomeUruguayUzbekistanVanuatuVenezuela, RBVietnamVirgin Islands (U.S.)West Bank and GazaWorldYemen, Rep.ZambiaZimbabwe Timeline:
This timeline shows a graph from 1961 to 2016 of Cyprus. No data until 1960. Number of actual observations by date: 56.
Source name:
World Development Indicators
Source organization:
World Bank staff estimates based on male/female distributions of United Nations Population Division's World Population Prospects.
Categories, topics:
Health
Last updated:
apr 23, 2017
Indicators value changes by year
Minimum:
48.928
jan 1, 2013
Maximum:
50.927
jan 1, 1965
At the date of observation
Value
Absolute change
Change from previous value
jan 1, 1961
50.838
+50.838
0.0%
jan 1, 1962
50.843
+0.005
0.01%
jan 1, 1963
50.869
+0.026
0.05%
jan 1, 1964
50.904
+0.035
0.07%
jan 1, 1965
50.927
+0.023
0.05%
jan 1, 1966
50.924
-0.003
-0.01%
jan 1, 1967
50.891
-0.033
-0.06%
jan 1, 1968
50.835
-0.057
-0.11%
jan 1, 1969
50.759
-0.075
-0.15%
jan 1, 1970
50.674
-0.086
-0.17%
jan 1, 1971
50.583
-0.091
-0.18%
jan 1, 1972
50.489
-0.094
-0.19%
jan 1, 1973
50.392
-0.097
-0.19%
jan 1, 1974
50.292
-0.1
-0.2%
jan 1, 1975
50.191
-0.102
-0.2%
jan 1, 1976
50.089
-0.102
-0.2%
jan 1, 1977
49.987
-0.102
-0.2%
jan 1, 1978
49.887
-0.1
-0.2%
jan 1, 1979
49.793
-0.094
-0.19%
jan 1, 1980
49.712
-0.081
-0.16%
jan 1, 1981
49.646
-0.066
-0.13%
jan 1, 1982
49.599
-0.047
-0.1%
jan 1, 1983
49.568
-0.031
-0.06%
jan 1, 1984
49.545
-0.023
-0.05%
jan 1, 1985
49.52
-0.024
-0.05%
jan 1, 1986
49.487
-0.033
-0.07%
jan 1, 1987
49.442
-0.045
-0.09%
jan 1, 1988
49.391
-0.052
-0.1%
jan 1, 1989
49.342
-0.048
-0.1%
jan 1, 1990
49.311
-0.031
-0.06%
jan 1, 1991
49.306
-0.005
-0.01%
jan 1, 1992
49.327
+0.021
0.04%
jan 1, 1993
49.369
+0.042
0.09%
jan 1, 1994
49.423
+0.054
0.11%
jan 1, 1995
49.476
+0.053
0.11%
jan 1, 1996
49.521
+0.045
0.09%
jan 1, 1997
49.555
+0.034
0.07%
jan 1, 1998
49.58
+0.025
0.05%
jan 1, 1999
49.595
+0.015
0.03%
jan 1, 2000
49.602
+0.006
0.01%
jan 1, 2001
49.599
-0.003
-0.01%
jan 1, 2002
49.59
-0.01
-0.02%
jan 1, 2003
49.572
-0.017
-0.03%
jan 1, 2004
49.543
-0.029
-0.06%
jan 1, 2005
49.496
-0.047
-0.1%
jan 1, 2006
49.428
-0.068
-0.14%
jan 1, 2007
49.337
-0.091
-0.18%
jan 1, 2008
49.229
-0.109
-0.22%
jan 1, 2009
49.118
-0.111
-0.23%
jan 1, 2010
49.024
-0.094
-0.19%
jan 1, 2011
48.959
-0.064
-0.13%
jan 1, 2012
48.929
-0.03
-0.06%
jan 1, 2013
48.928
-0.001
0.0%
jan 1, 2014
48.946
+0.018
0.04%
jan 1, 2015
48.968
+0.022
0.04%
jan 1, 2016
48.984
+0.016
0.03%
Ranking of countries by current statistics by years


Comments: