29
/
en
AIzaSyAYiBZKx7MnpbEhh9jyipgxe19OcubqV5w
April 1, 2024
117135
Cyprus
CYP
true
2
1
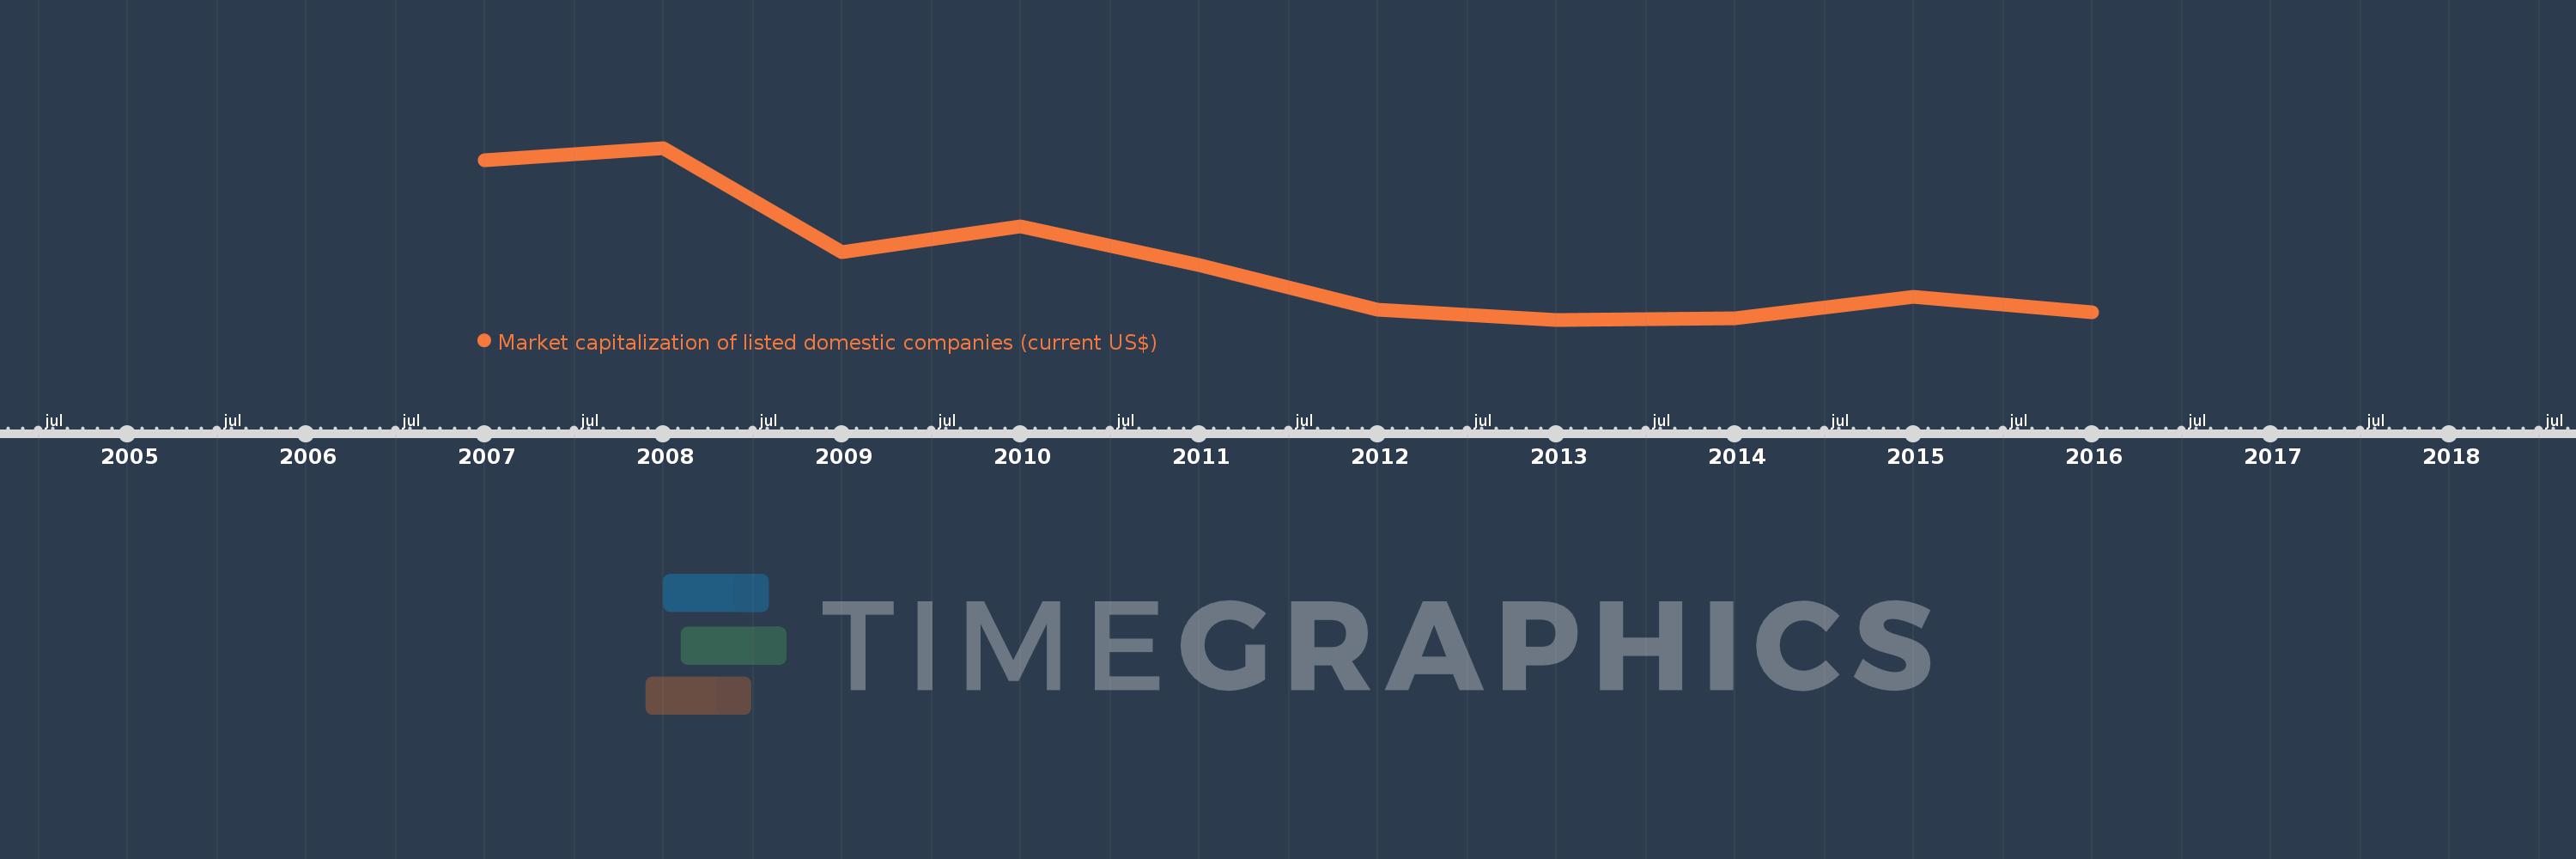
Market capitalization of listed domestic companies (current US$)
2016,2015,2014,2013,2012,2011,2010,2009,2008,2007
This statistics in other country:
Timeline:
This timeline shows a graph from 2007 to 2016 of Cyprus. No data until 2006. Number of actual observations by date: 10.
Source name:
World Development Indicators
Source organization:
World Federation of Exchanges database.
Categories, topics:
Financial Sector
Last updated:
apr 23, 2017
Indicators value changes by year
Minimum:
1.996 bln
jan 1, 2013
Maximum:
17.251 bln
jan 1, 2008
At the date of observation
Value
Absolute change
Change from previous value
jan 1, 2007
16.158 bln
+16.158 bln
0.0%
jan 1, 2008
17.251 bln
+1.093 bln
6.77%
jan 1, 2009
7.988 bln
-9.263 bln
-53.7%
jan 1, 2010
10.269 bln
+2.281 bln
28.55%
jan 1, 2011
6.834 bln
-3.435 bln
-33.45%
jan 1, 2012
2.853 bln
-3.981 bln
-58.25%
jan 1, 2013
1.996 bln
-857.57 mln
-30.06%
jan 1, 2014
2.105 bln
+108.98 mln
5.46%
jan 1, 2015
4.031 bln
+1.926 bln
91.52%
jan 1, 2016
2.692 bln
-1.339 bln
-33.21%
Ranking of countries by current statistics by years


Comments: