29
/
en
AIzaSyAYiBZKx7MnpbEhh9jyipgxe19OcubqV5w
April 1, 2024
113993
Cote d'Ivoire
CIV
true
2
1
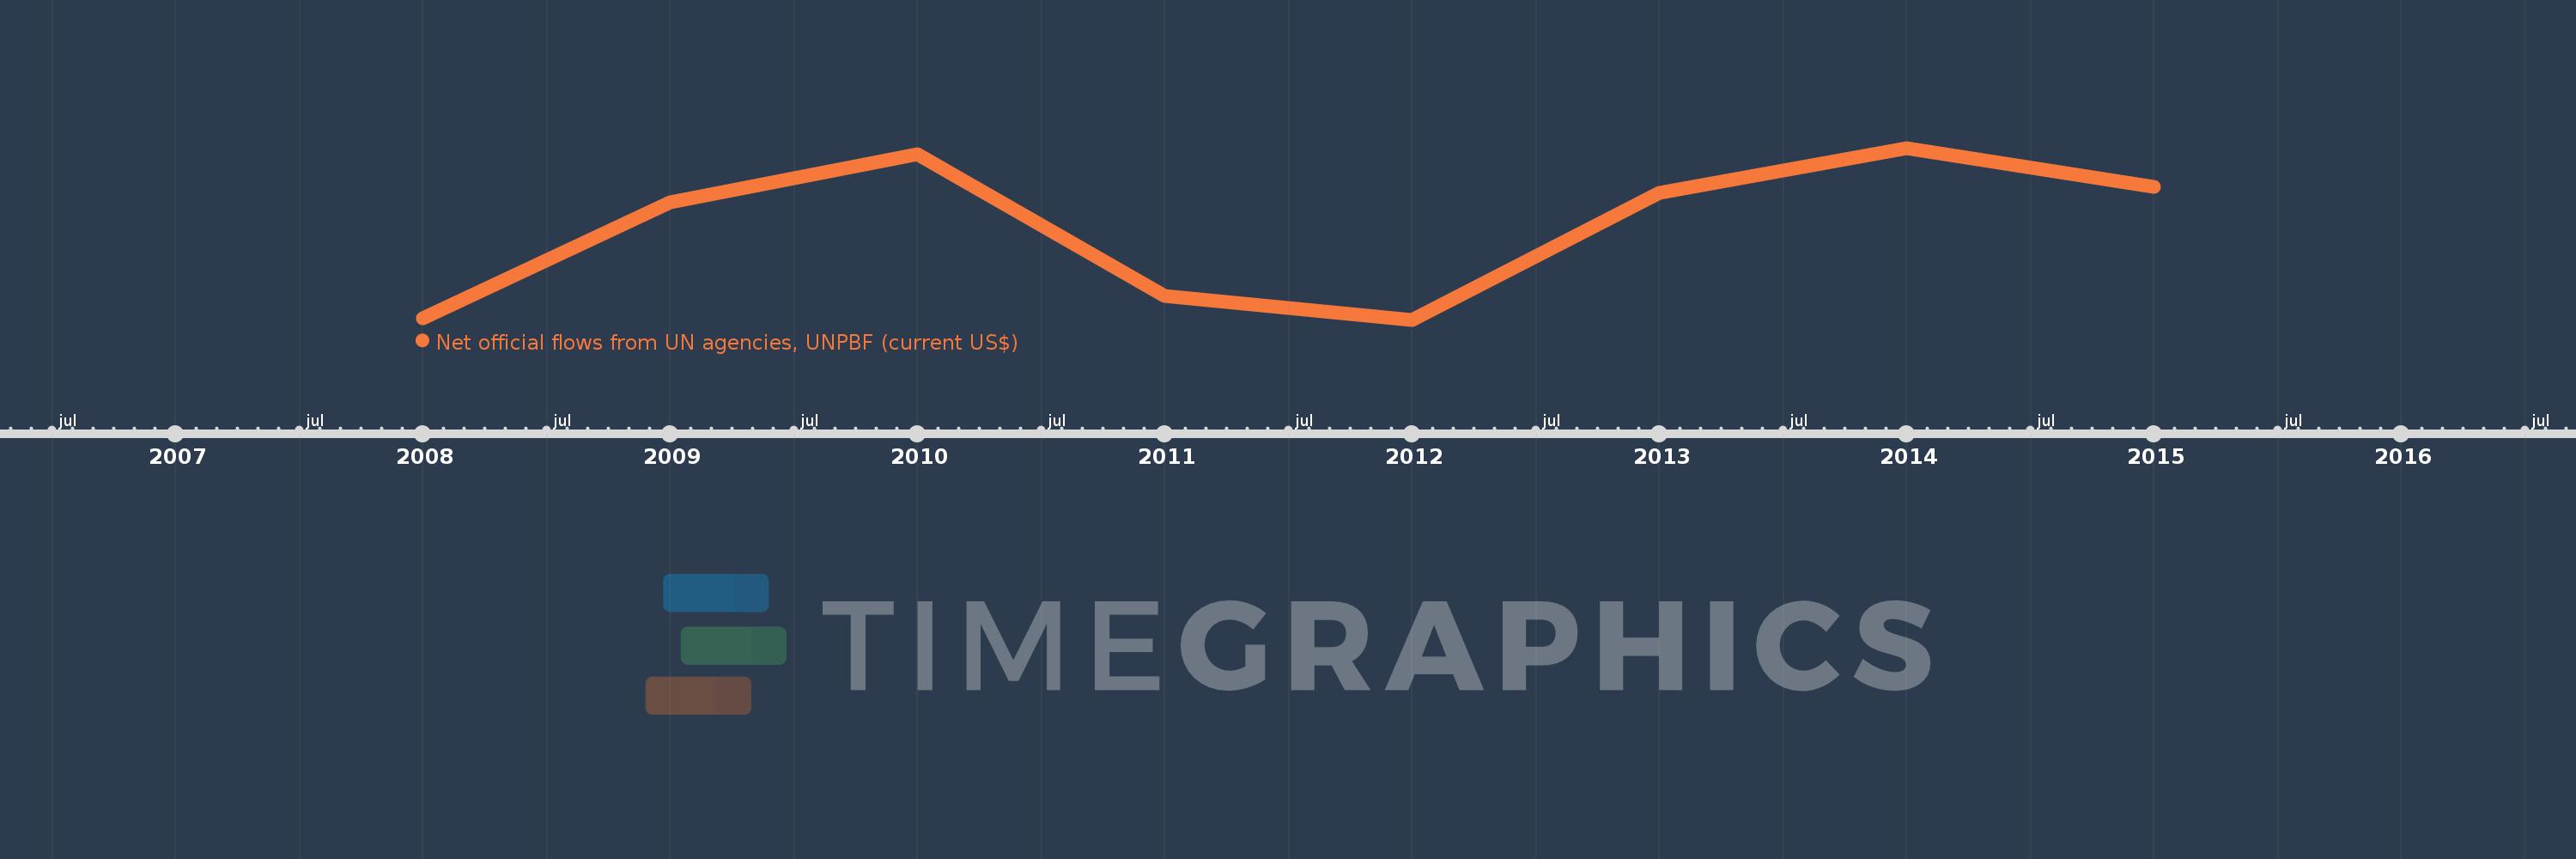
Net official flows from UN agencies, UNPBF (current US$)
2015,2014,2013,2012,2011,2010,2009,2008
This statistics in other country:
Timeline:
This timeline shows a graph from 2008 to 2015 of Cote d'Ivoire. No data until 2007. Number of actual observations by date: 8.
Source name:
World Development Indicators
Source organization:
Development Assistance Committee of the Organisation for Economic Co-operation and Development, Geographical Distribution of Financial Flows to Developing Countries, Development Co-operation Report, and International Development Statistics database. Data are available online at: www.oecd.org/dac/stats/idsonline.
Categories, topics:
Aid Effectiveness
Last updated:
apr 23, 2017
Indicators value changes by year
Maximum:
4.46 mln
jan 1, 2014
At the date of observation
Value
Absolute change
Change from previous value
jan 1, 2008
60.0K
+60.0K
0.0%
jan 1, 2009
3.05 mln
+2.99 mln
4.98K%
jan 1, 2010
4.29 mln
+1.24 mln
40.66%
jan 1, 2011
650.0K
-3.64 mln
-84.85%
jan 1, 2012
30.0K
-620.0K
-95.38%
jan 1, 2013
3.31 mln
+3.28 mln
10.93K%
jan 1, 2014
4.46 mln
+1.15 mln
34.74%
jan 1, 2015
3.46 mln
-1000.0K
-22.42%
Ranking of countries by current statistics by years


Comments: