29
/
en
AIzaSyAYiBZKx7MnpbEhh9jyipgxe19OcubqV5w
April 1, 2024
112138
Costa Rica
CRI
true
2
1
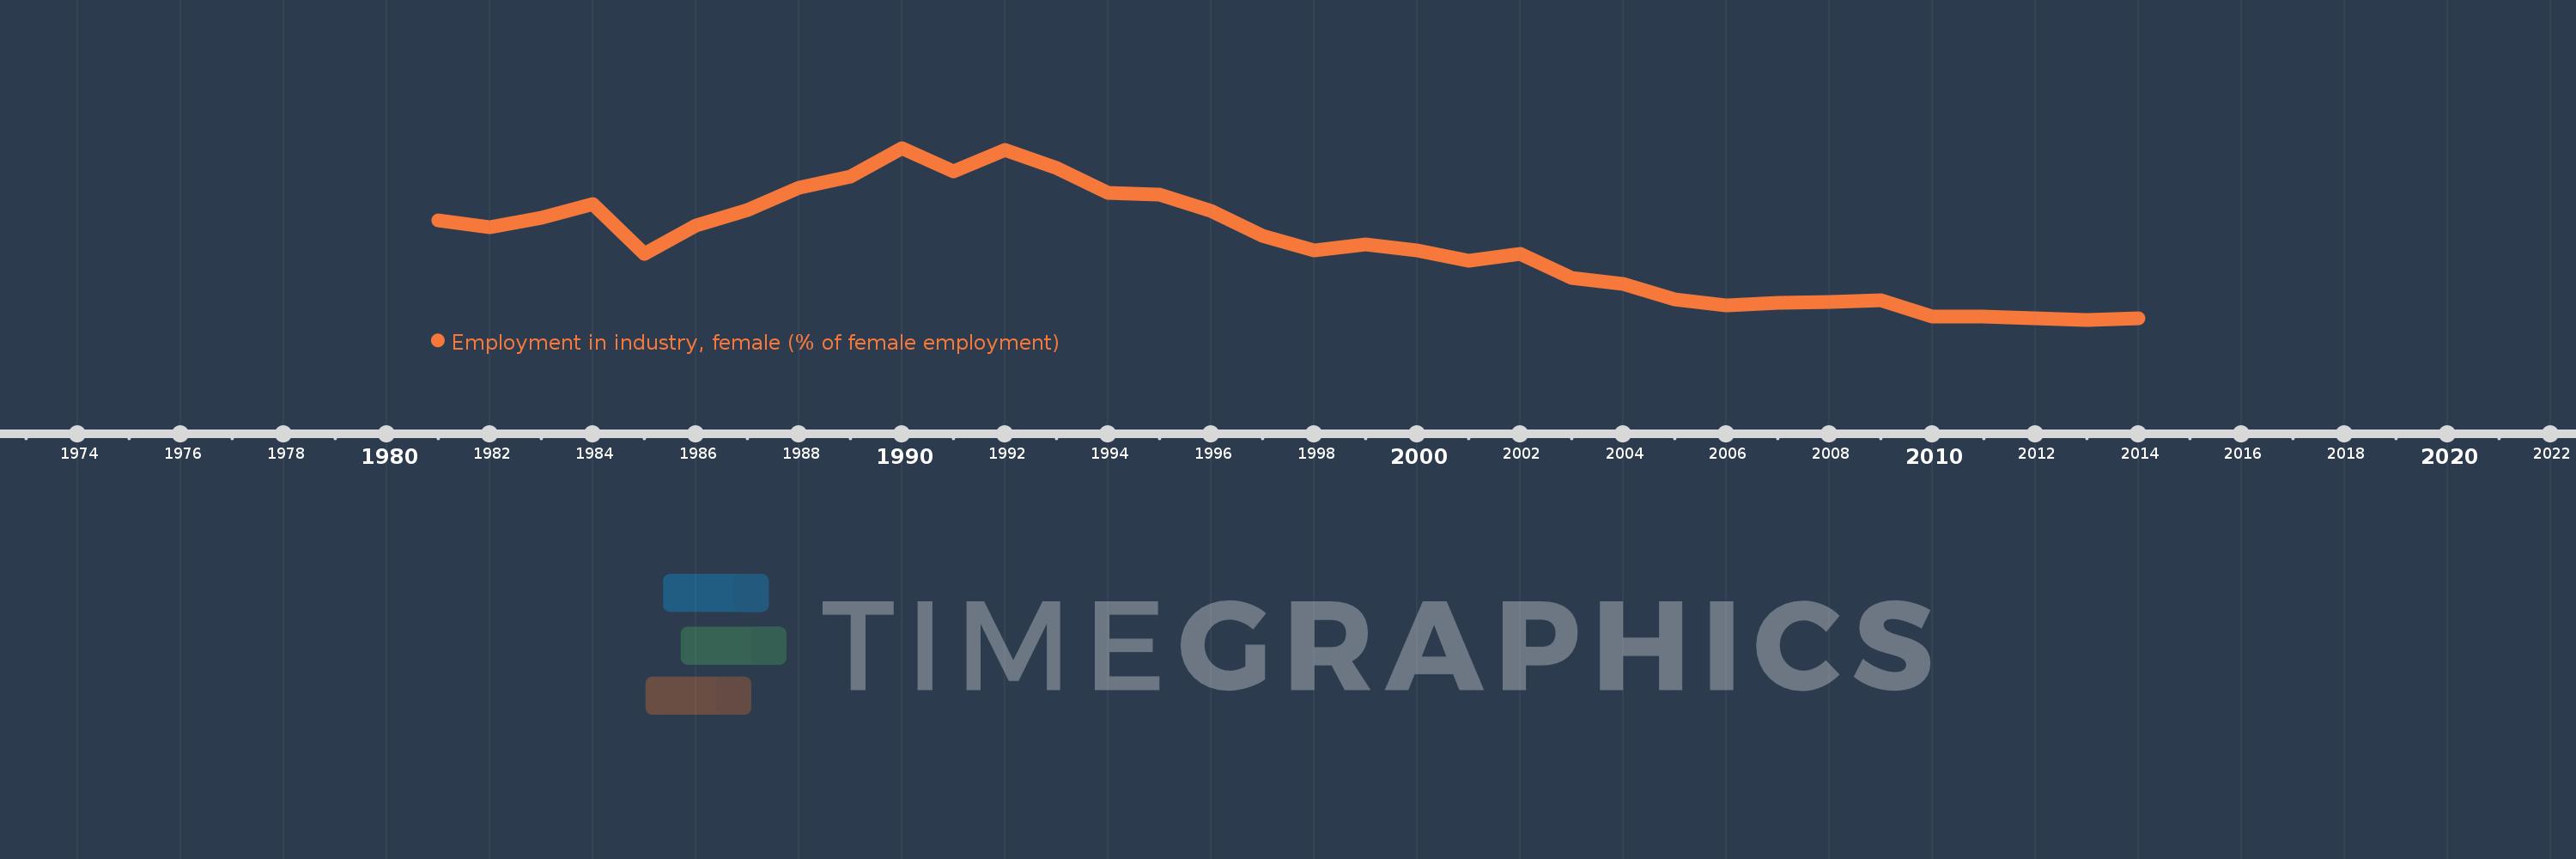
Employment in industry, female (% of female employment)
2014,2013,2012,2011,2010,2009,2008,2007,2006,2005,2004,2003,2002,2001,2000,1999,1998,1997,1996,1995,1994,1993,1992,1991,1990,1989,1988,1987,1986,1985,1984,1983,1982,1981
This statistics in other country:
AlbaniaAlgeriaAmerican SamoaAntigua and BarbudaArab WorldArgentinaArmeniaArubaAustraliaAustriaAzerbaijanBahamas, TheBahrainBangladeshBarbadosBelarusBelgiumBelizeBeninBermudaBhutanBoliviaBotswanaBrazilBritish Virgin IslandsBrunei DarussalamBulgariaBurkina FasoBurundiCambodiaCameroonCanadaCaribbean small statesCayman IslandsCentral Europe and the BalticsChadChileChinaColombiaCongo, Rep.Costa RicaCroatiaCubaCyprusCzech RepublicDenmarkDominicaDominican RepublicEarly-demographic dividendEast Asia & PacificEast Asia & Pacific (excluding high income)East Asia & Pacific (IDA & IBRD countries)EcuadorEgypt, Arab Rep.El SalvadorEquatorial GuineaEstoniaEthiopiaEuro areaEurope & Central AsiaEurope & Central Asia (excluding high income)Europe & Central Asia (IDA & IBRD countries)European UnionFaroe IslandsFijiFinlandFranceGabonGambia, TheGeorgiaGermanyGhanaGreeceGreenlandGrenadaGuatemalaGuineaGuyanaHaitiHigh incomeHondurasHong Kong SAR, ChinaHungaryIBRD onlyIcelandIDA & IBRD totalIDA blendIndiaIndonesiaIran, Islamic Rep.IraqIrelandIsle of ManIsraelItalyJamaicaJapanJordanKazakhstanKenyaKiribatiKorea, Rep.KosovoKuwaitKyrgyz RepublicLao PDRLate-demographic dividendLatin America & Caribbean Latin America & Caribbean (excluding high income)Latin America & the Caribbean (IDA & IBRD countries)LatviaLesothoLiberiaLithuaniaLow & middle incomeLower middle incomeLuxembourgMacao SAR, ChinaMacedonia, FYRMadagascarMalawiMalaysiaMaldivesMaliMaltaMarshall IslandsMauritiusMexicoMiddle East & North AfricaMiddle East & North Africa (excluding high income)Middle East & North Africa (IDA & IBRD countries)Middle incomeMoldovaMongoliaMontenegroMoroccoMozambiqueNamibiaNepalNetherlandsNew CaledoniaNew ZealandNicaraguaNigerNigeriaNorth AmericaNorthern Mariana IslandsNorwayOECD membersOmanPakistanPalauPanamaParaguayPeruPhilippinesPolandPortugalPost-demographic dividendPuerto RicoQatarRomaniaRussian FederationRwandaSamoaSan MarinoSao Tome and PrincipeSaudi ArabiaSenegalSerbiaSeychellesSierra LeoneSingaporeSlovak RepublicSloveniaSouth AfricaSouth AsiaSouth Asia (IDA & IBRD)SpainSri LankaSt. Kitts and NevisSt. LuciaSt. Vincent and the GrenadinesSudanSurinameSwedenSwitzerlandSyrian Arab RepublicTajikistanTanzaniaThailandTimor-LesteTogoTongaTrinidad and TobagoTunisiaTurkeyUgandaUkraineUnited Arab EmiratesUnited KingdomUnited StatesUpper middle incomeUruguayVanuatuVenezuela, RBVietnamWest Bank and GazaWorldYemen, Rep.ZambiaZimbabwe Timeline:
This timeline shows a graph from 1981 to 2014 of Costa Rica. No data until 1980. Number of actual observations by date: 34.
Source name:
World Development Indicators
Source organization:
International Labour Organization, Key Indicators of the Labour Market database.
Categories, topics:
Social Protection & Labor, Gender
Last updated:
apr 23, 2017
Indicators value changes by year
At the date of observation
Value
Absolute change
Change from previous value
jan 1, 1981
20.1
+20.1
0.0%
jan 1, 1982
19.5
-0.6
-2.99%
jan 1, 1983
20.3
+0.8
4.1%
jan 1, 1984
21.5
+1.2
5.91%
jan 1, 1985
17.1
-4.4
-20.47%
jan 1, 1986
19.6
+2.5
14.62%
jan 1, 1987
21.0
+1.4
7.14%
jan 1, 1988
23.0
+2.0
9.52%
jan 1, 1989
24.0
+1.0
4.35%
jan 1, 1990
26.5
+2.5
10.42%
jan 1, 1991
24.4
-2.1
-7.92%
jan 1, 1992
26.3
+1.9
7.79%
jan 1, 1993
24.7
-1.6
-6.08%
jan 1, 1994
22.5
-2.2
-8.91%
jan 1, 1995
22.4
-0.1
-0.44%
jan 1, 1996
20.9
-1.5
-6.7%
jan 1, 1997
18.7
-2.2
-10.53%
jan 1, 1998
17.4
-1.3
-6.95%
jan 1, 1999
18.0
+0.6
3.45%
jan 1, 2000
17.4
-0.6
-3.33%
jan 1, 2001
16.5
-0.9
-5.17%
jan 1, 2002
17.1
+0.6
3.64%
jan 1, 2003
15.0
-2.1
-12.28%
jan 1, 2004
14.5
-0.5
-3.33%
jan 1, 2005
13.1
-1.4
-9.66%
jan 1, 2006
12.6
-0.5
-3.82%
jan 1, 2007
12.8
+0.2
1.59%
jan 1, 2008
12.9
+0.1
0.78%
jan 1, 2009
13.0
+0.1
0.78%
jan 1, 2010
11.6
-1.4
-10.77%
jan 1, 2012
11.4
-0.2
-1.72%
jan 1, 2013
11.3
-0.1
-0.88%
jan 1, 2014
11.4
+0.1
0.88%
Ranking of countries by current statistics by years


Comments: