29
/
en
AIzaSyAYiBZKx7MnpbEhh9jyipgxe19OcubqV5w
April 1, 2024
110197
Congo, Dem. Rep.
COD
true
2
1
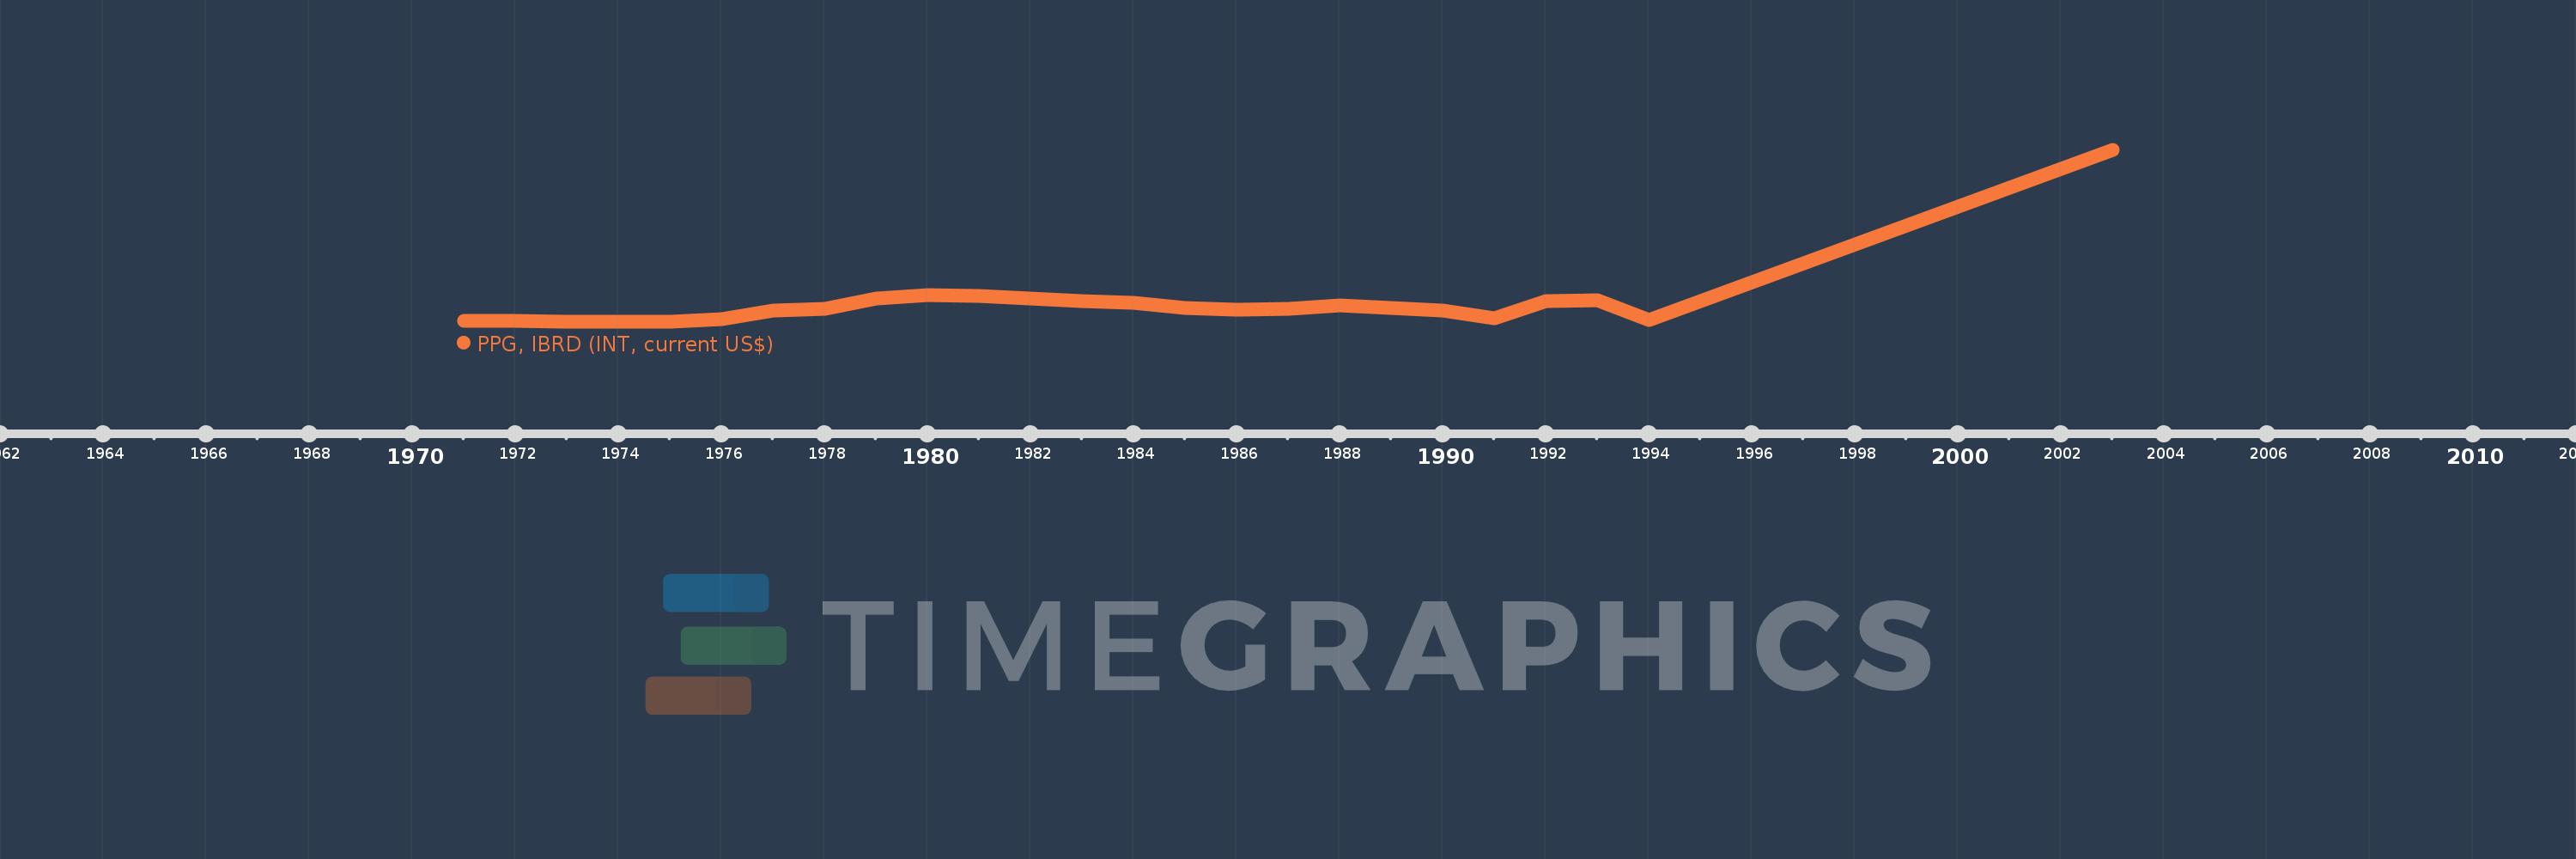
PPG, IBRD (INT, current US$)
2003,1994,1993,1992,1991,1990,1989,1988,1987,1986,1985,1984,1983,1982,1981,1980,1979,1978,1977,1976,1975,1974,1973,1972,1971
This statistics in other country:
Timeline:
This timeline shows a graph from 1971 to 2003 of Congo, Dem. Rep.. No data until 1970. Number of actual observations by date: 25.
Source name:
World Development Indicators
Source organization:
World Bank, International Debt Statistics.
Categories, topics:
External Debt
Last updated:
apr 23, 2017
Indicators value changes by year
Maximum:
50.777 mln
jan 1, 2003
At the date of observation
Value
Absolute change
Change from previous value
jan 1, 1971
353.0K
+353.0K
0.0%
jan 1, 1972
293.0K
-60.0K
-17.0%
jan 1, 1973
191.0K
-102.0K
-34.81%
jan 1, 1974
132.0K
-59.0K
-30.89%
jan 1, 1975
73.0K
-59.0K
-44.7%
jan 1, 1976
829.0K
+756.0K
1.04K%
jan 1, 1977
3.444 mln
+2.615 mln
315.44%
jan 1, 1978
3.971 mln
+527.0K
15.3%
jan 1, 1979
6.88 mln
+2.909 mln
73.26%
jan 1, 1980
7.887 mln
+1.007 mln
14.64%
jan 1, 1981
7.761 mln
-126.0K
-1.6%
jan 1, 1982
7.085 mln
-676.0K
-8.71%
jan 1, 1983
6.322 mln
-763.0K
-10.77%
jan 1, 1984
5.832 mln
-490.0K
-7.75%
jan 1, 1985
4.192 mln
-1.64 mln
-28.12%
jan 1, 1986
3.801 mln
-391.0K
-9.33%
jan 1, 1987
4.062 mln
+261.0K
6.87%
jan 1, 1988
4.956 mln
+894.0K
22.01%
jan 1, 1989
4.217 mln
-739.0K
-14.91%
jan 1, 1990
3.401 mln
-816.0K
-19.35%
jan 1, 1991
1.275 mln
-2.126 mln
-62.51%
jan 1, 1992
6.207 mln
+4.932 mln
386.82%
jan 1, 1993
6.605 mln
+398.0K
6.41%
jan 1, 1994
641.0K
-5.964 mln
-90.3%
jan 1, 2003
50.777 mln
+50.136 mln
7.82K%
Ranking of countries by current statistics by years


Comments: