29
/
en
AIzaSyAYiBZKx7MnpbEhh9jyipgxe19OcubqV5w
April 1, 2024
109613
Congo, Dem. Rep.
COD
true
2
1
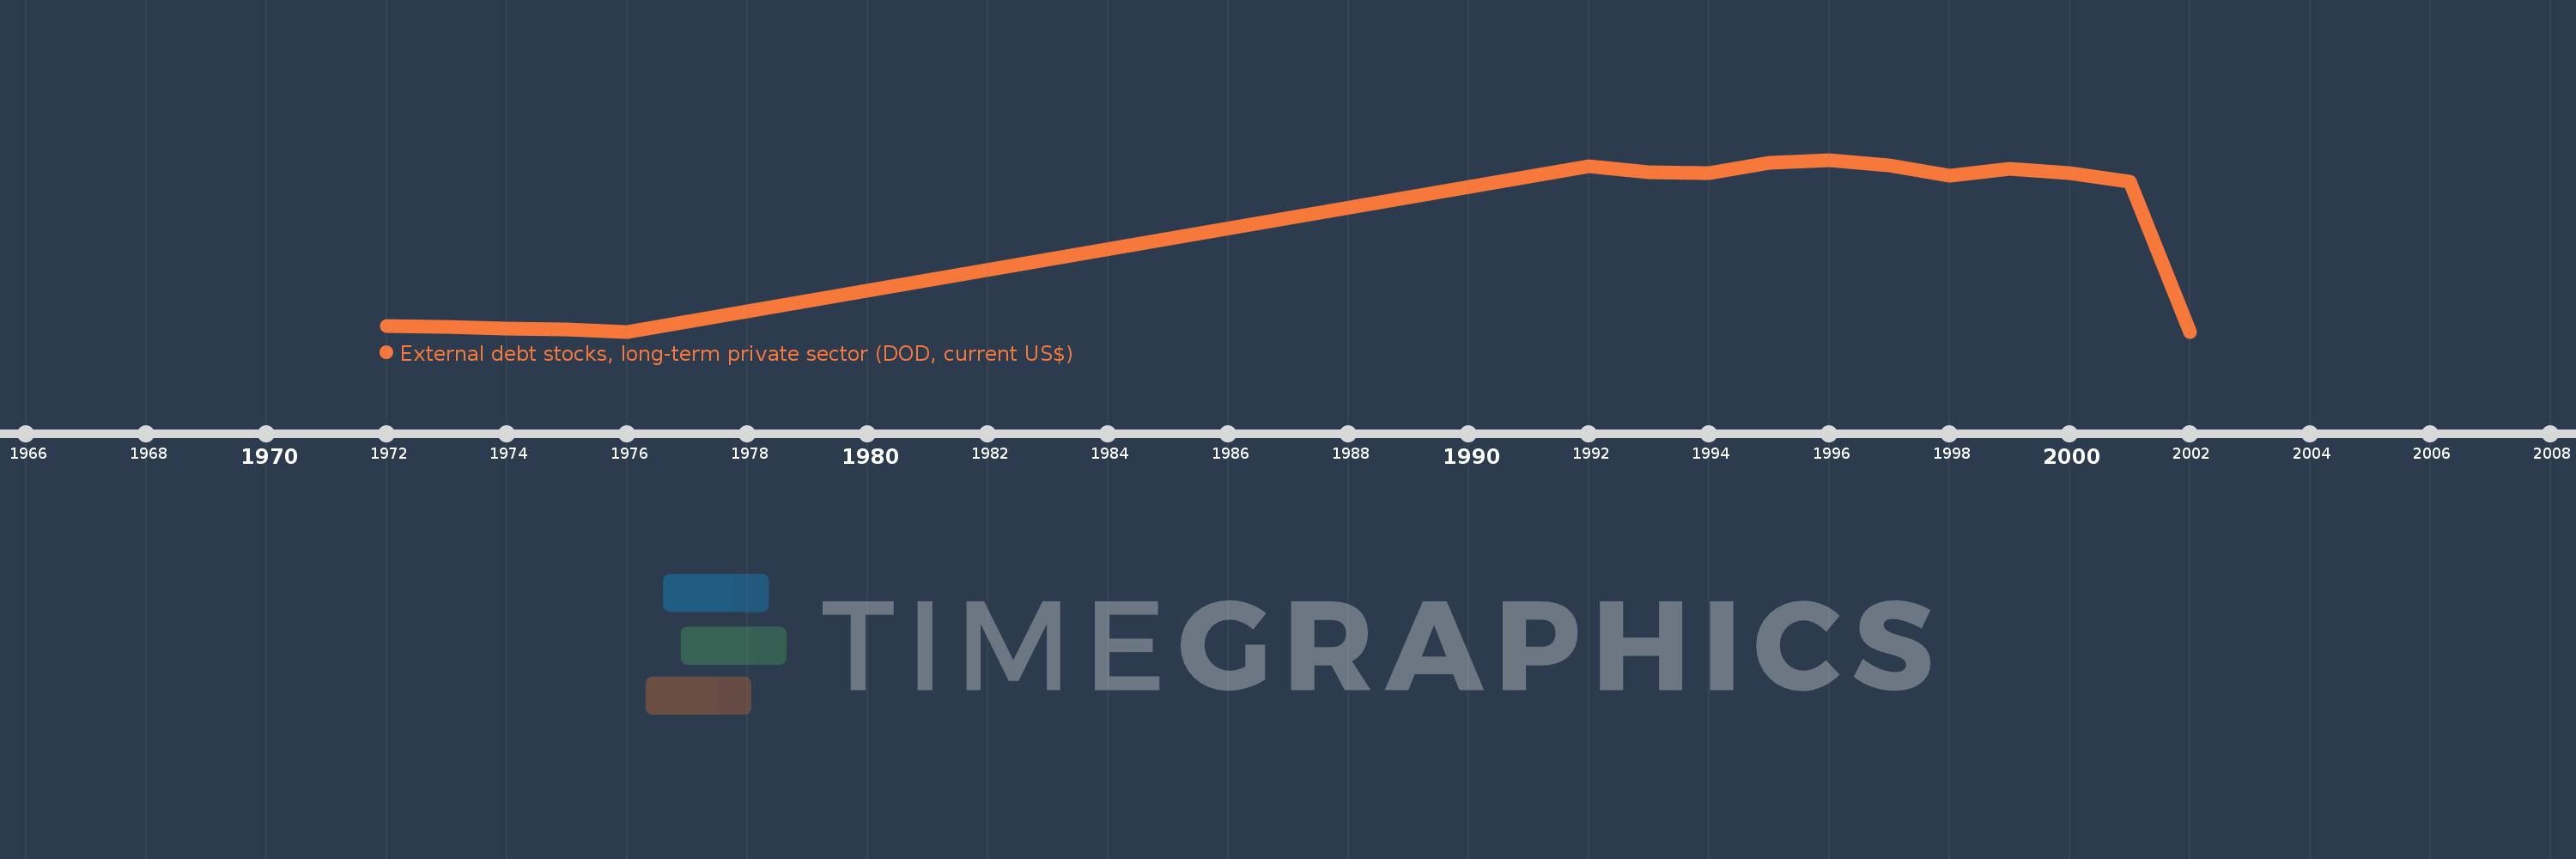
External debt stocks, long-term private sector (DOD, current US$)
2002,2001,2000,1999,1998,1997,1996,1995,1994,1993,1992,1976,1975,1974,1973,1972
This statistics in other country:
Timeline:
This timeline shows a graph from 1972 to 2002 of Congo, Dem. Rep.. No data until 1971. Number of actual observations by date: 16.
Source name:
World Development Indicators
Source organization:
World Bank, International Debt Statistics.
Categories, topics:
External Debt
Last updated:
apr 23, 2017
Indicators value changes by year
Maximum:
14.965 mln
jan 1, 1996
At the date of observation
Value
Absolute change
Change from previous value
jan 1, 1972
507.0K
+507.0K
0.0%
jan 1, 1973
395.0K
-112.0K
-22.09%
jan 1, 1974
281.0K
-114.0K
-28.86%
jan 1, 1975
169.0K
-112.0K
-39.86%
jan 1, 1976
0.0
-169.0K
-100.0%
jan 1, 1992
14.4 mln
+14.4 mln
%
jan 1, 1993
13.843 mln
-557.0K
-3.87%
jan 1, 1994
13.827 mln
-16.0K
-0.12%
jan 1, 1995
14.696 mln
+869.0K
6.28%
jan 1, 1996
14.965 mln
+269.0K
1.83%
jan 1, 1997
14.476 mln
-489.0K
-3.27%
jan 1, 1998
13.584 mln
-892.0K
-6.16%
jan 1, 1999
14.176 mln
+592.0K
4.36%
jan 1, 2000
13.816 mln
-360.0K
-2.54%
jan 1, 2001
13.047 mln
-769.0K
-5.57%
jan 1, 2002
0.0
-13.047 mln
-100.0%
Ranking of countries by current statistics by years


Comments: