29
/
en
AIzaSyAYiBZKx7MnpbEhh9jyipgxe19OcubqV5w
April 1, 2024
107674
Colombia
COL
true
2
1
Net taxes on products (constant LCU)
2016,2015,2014,2013,2012,2011,2010,2009,2008,2007,2006,2005,2004,2003,2002,2001,2000,1999,1998,1997,1996,1995,1994,1993,1992,1991
This statistics in other country:
Timeline:
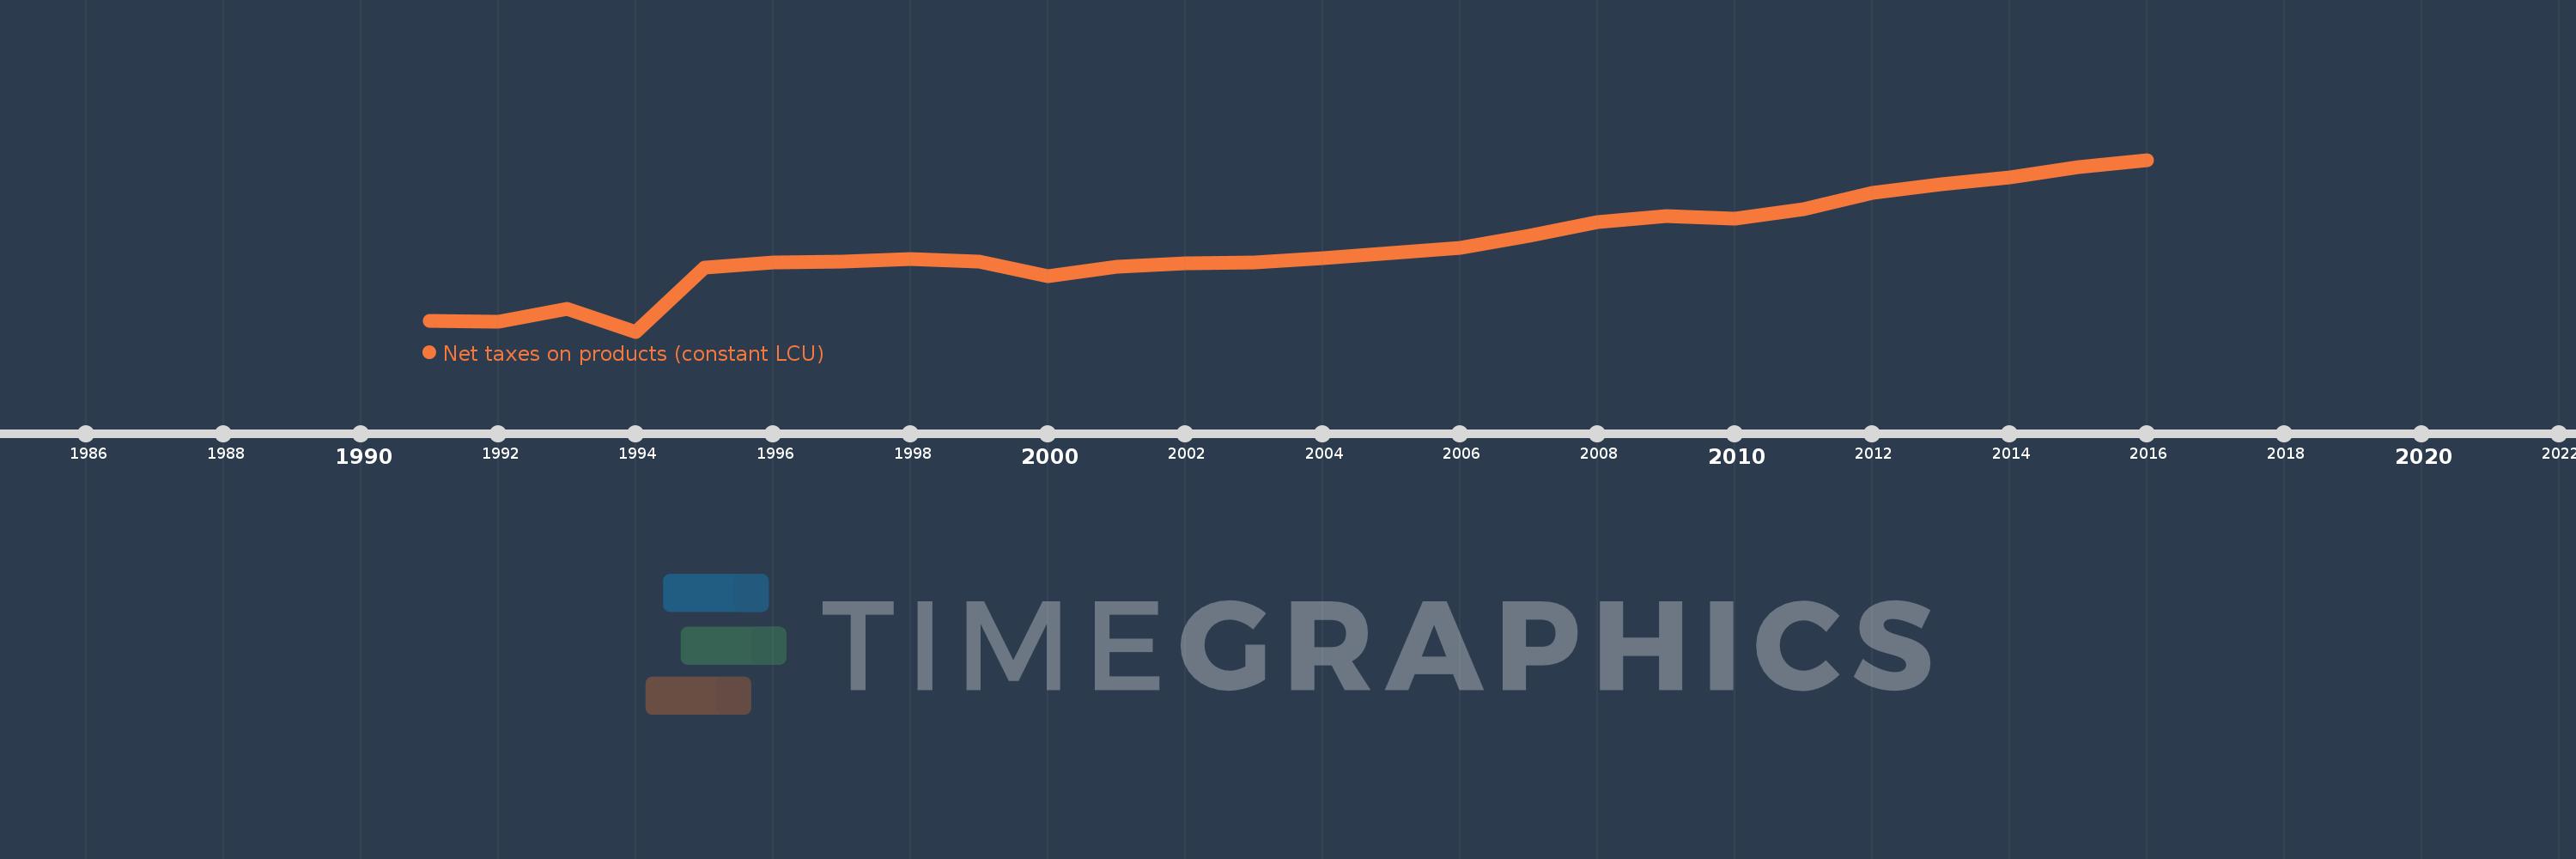
This timeline shows a graph from 1991 to 2016 of Colombia. No data until 1990. Number of actual observations by date: 26.
Source name:
World Development Indicators
Source organization:
World Bank national accounts data, and OECD National Accounts data files.
Categories, topics:
Economy & Growth
Last updated:
apr 23, 2017
Indicators value changes by year
Minimum:
6.676 trl
jan 1, 1994
Maximum:
52.294 trl
jan 1, 2016
At the date of observation
Value
Absolute change
Change from previous value
jan 1, 1991
9.418 trl
+9.418 trl
0.0%
jan 1, 1992
9.285 trl
-132.643 bln
-1.41%
jan 1, 1993
12.689 trl
+3.404 trl
36.67%
jan 1, 1994
6.676 trl
-6.013 trl
-47.39%
jan 1, 1995
23.699 trl
+17.022 trl
254.96%
jan 1, 1996
24.925 trl
+1.226 trl
5.17%
jan 1, 1997
25.162 trl
+236.986 bln
0.95%
jan 1, 1998
25.906 trl
+743.84 bln
2.96%
jan 1, 1999
25.204 trl
-701.765 bln
-2.71%
jan 1, 2000
21.321 trl
-3.883 trl
-15.41%
jan 1, 2001
23.99 trl
+2.669 trl
12.52%
jan 1, 2002
24.763 trl
+773.0 bln
3.22%
jan 1, 2003
24.927 trl
+164.0 bln
0.66%
jan 1, 2004
26.277 trl
+1.35 trl
5.42%
jan 1, 2005
27.523 trl
+1.246 trl
4.74%
jan 1, 2006
28.875 trl
+1.352 trl
4.91%
jan 1, 2007
32.05 trl
+3.175 trl
11.0%
jan 1, 2008
35.762 trl
+3.712 trl
11.58%
jan 1, 2009
37.297 trl
+1.535 trl
4.29%
jan 1, 2010
36.662 trl
-635.0 bln
-1.7%
jan 1, 2011
39.088 trl
+2.426 trl
6.62%
jan 1, 2012
43.42 trl
+4.332 trl
11.08%
jan 1, 2013
45.77 trl
+2.35 trl
5.41%
jan 1, 2014
47.608 trl
+1.838 trl
4.02%
jan 1, 2015
50.272 trl
+2.664 trl
5.6%
jan 1, 2016
52.294 trl
+2.022 trl
4.02%
Ranking of countries by current statistics by years


Comments: