29
/
en
AIzaSyAYiBZKx7MnpbEhh9jyipgxe19OcubqV5w
April 1, 2024
106502
China
CHN
true
2
1
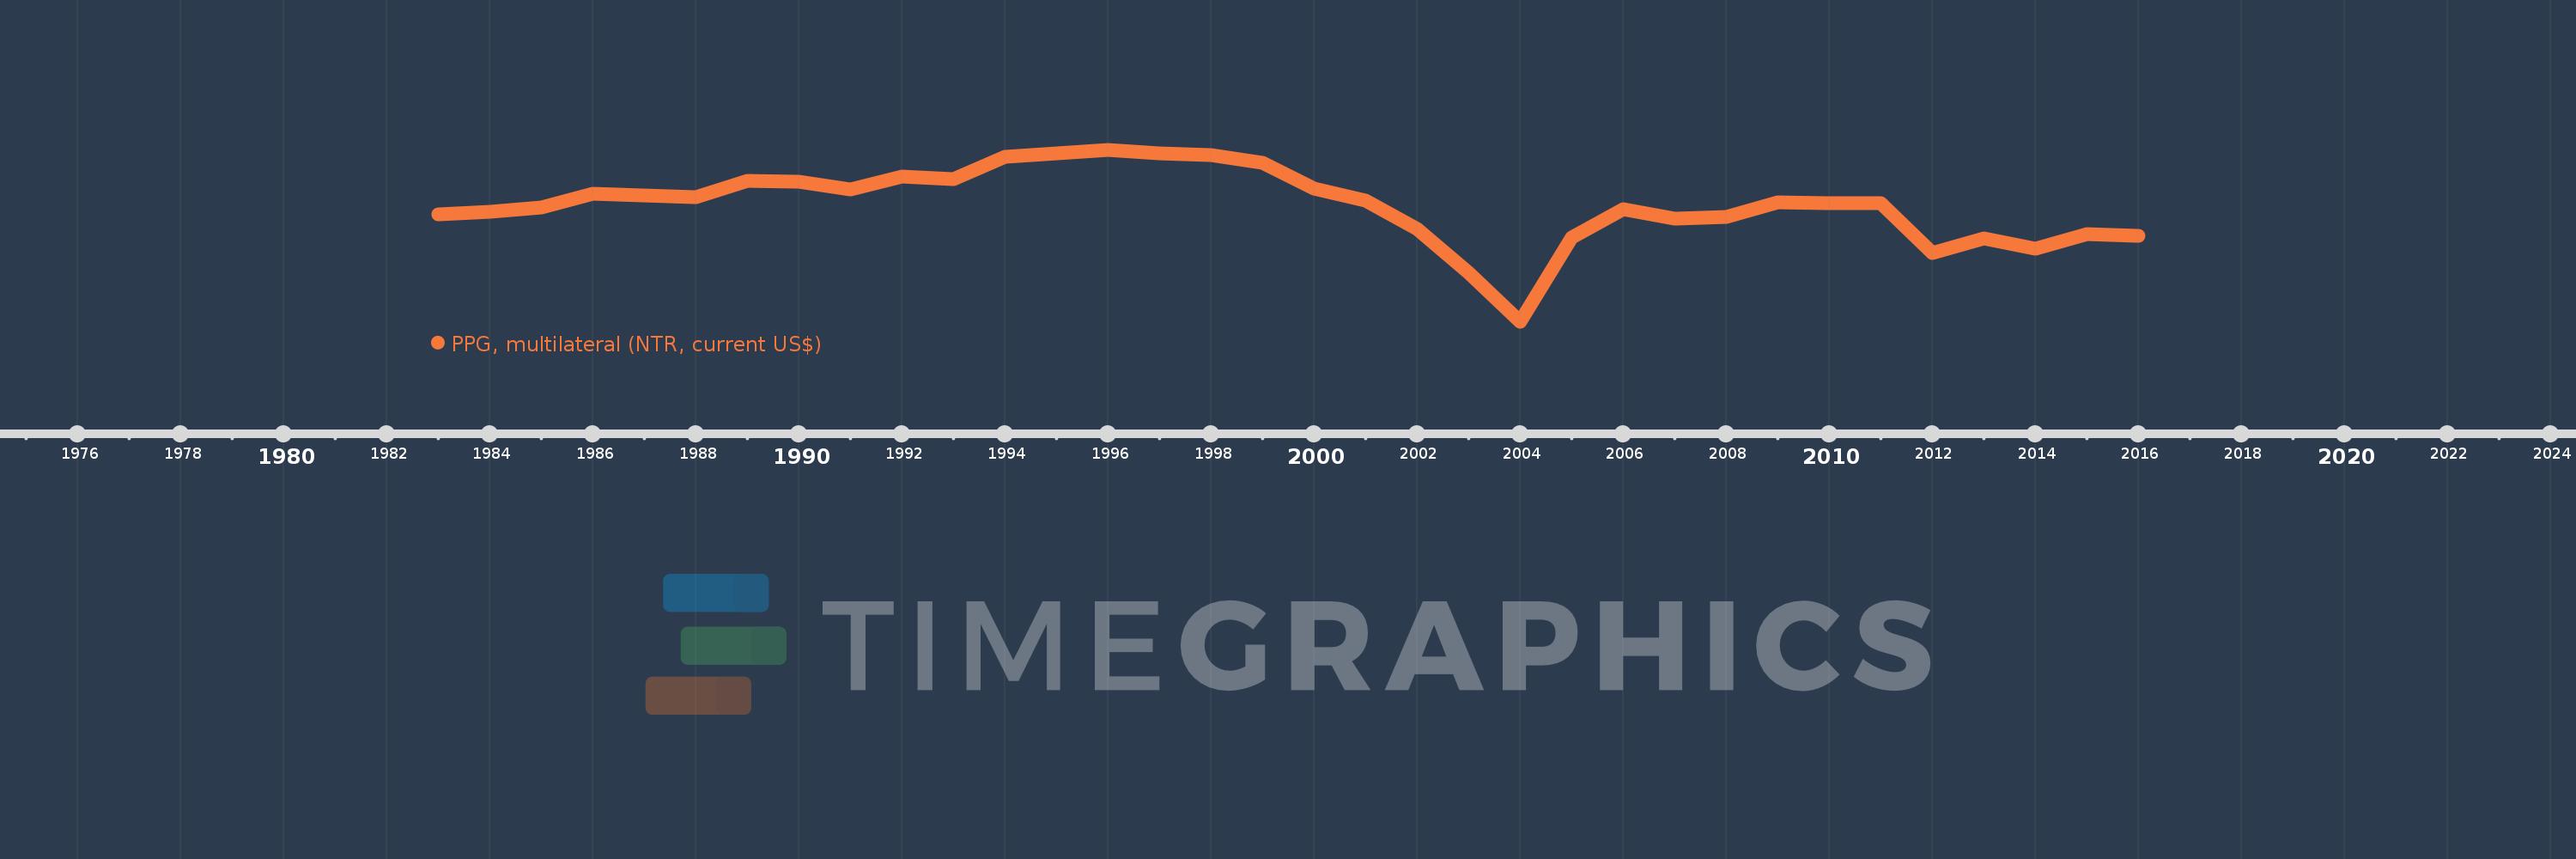
PPG, multilateral (NTR, current US$)
2016,2015,2014,2013,2012,2011,2010,2009,2008,2007,2006,2005,2004,2003,2002,2001,2000,1999,1998,1997,1996,1995,1994,1993,1992,1991,1990,1989,1988,1987,1986,1985,1984,1983
This statistics in other country:
Timeline:
This timeline shows a graph from 1983 to 2016 of China. No data until 1982. Number of actual observations by date: 34.
Source name:
World Development Indicators
Source organization:
World Bank, International Debt Statistics.
Categories, topics:
External Debt
Last updated:
apr 23, 2017
Indicators value changes by year
Minimum:
-3.01 bln
jan 1, 2004
Maximum:
1.799 bln
jan 1, 1996
At the date of observation
Value
Absolute change
Change from previous value
jan 1, 1983
883.0K
+883.0K
0.0%
jan 1, 1984
74.476 mln
+73.593 mln
8.33K%
jan 1, 1985
198.549 mln
+124.073 mln
166.59%
jan 1, 1986
568.864 mln
+370.315 mln
186.51%
jan 1, 1987
542.517 mln
-26.347 mln
-4.63%
jan 1, 1988
492.816 mln
-49.701 mln
-9.16%
jan 1, 1989
939.823 mln
+447.007 mln
90.7%
jan 1, 1990
927.11 mln
-12.713 mln
-1.35%
jan 1, 1991
711.901 mln
-215.209 mln
-23.21%
jan 1, 1992
1.052 bln
+339.642 mln
47.71%
jan 1, 1993
988.454 mln
-63.089 mln
-6.0%
jan 1, 1994
1.604 bln
+615.251 mln
62.24%
jan 1, 1995
1.72 bln
+116.421 mln
7.26%
jan 1, 1996
1.799 bln
+78.648 mln
4.57%
jan 1, 1997
1.699 bln
-100.24 mln
-5.57%
jan 1, 1998
1.654 bln
-44.065 mln
-2.59%
jan 1, 1999
1.438 bln
-216.359 mln
-13.08%
jan 1, 2000
735.403 mln
-702.707 mln
-48.86%
jan 1, 2001
384.636 mln
-350.767 mln
-47.7%
jan 1, 2002
-415.519 mln
-800.155 mln
-208.03%
jan 1, 2003
-1.644 bln
-1.228 bln
295.65%
jan 1, 2004
-3.01 bln
-1.366 bln
83.11%
jan 1, 2005
-639.712 mln
+2.371 bln
-78.75%
jan 1, 2006
134.877 mln
+774.589 mln
-121.08%
jan 1, 2007
-115.12 mln
-249.997 mln
-185.35%
jan 1, 2008
-76.465 mln
+38.655 mln
-33.58%
jan 1, 2009
341.5 mln
+417.965 mln
-546.61%
jan 1, 2010
322.952 mln
-18.548 mln
-5.43%
jan 1, 2011
306.547 mln
-16.405 mln
-5.08%
jan 1, 2012
-1.085 bln
-1.391 bln
-453.78%
jan 1, 2013
-666.123 mln
+418.384 mln
-38.58%
jan 1, 2014
-968.206 mln
-302.083 mln
45.35%
jan 1, 2015
-549.14 mln
+419.066 mln
-43.28%
jan 1, 2016
-596.376 mln
-47.236 mln
8.6%
Ranking of countries by current statistics by years


Comments: