29
/
en
AIzaSyAYiBZKx7MnpbEhh9jyipgxe19OcubqV5w
April 1, 2024
102804
Central African Republic
CAF
true
2
1
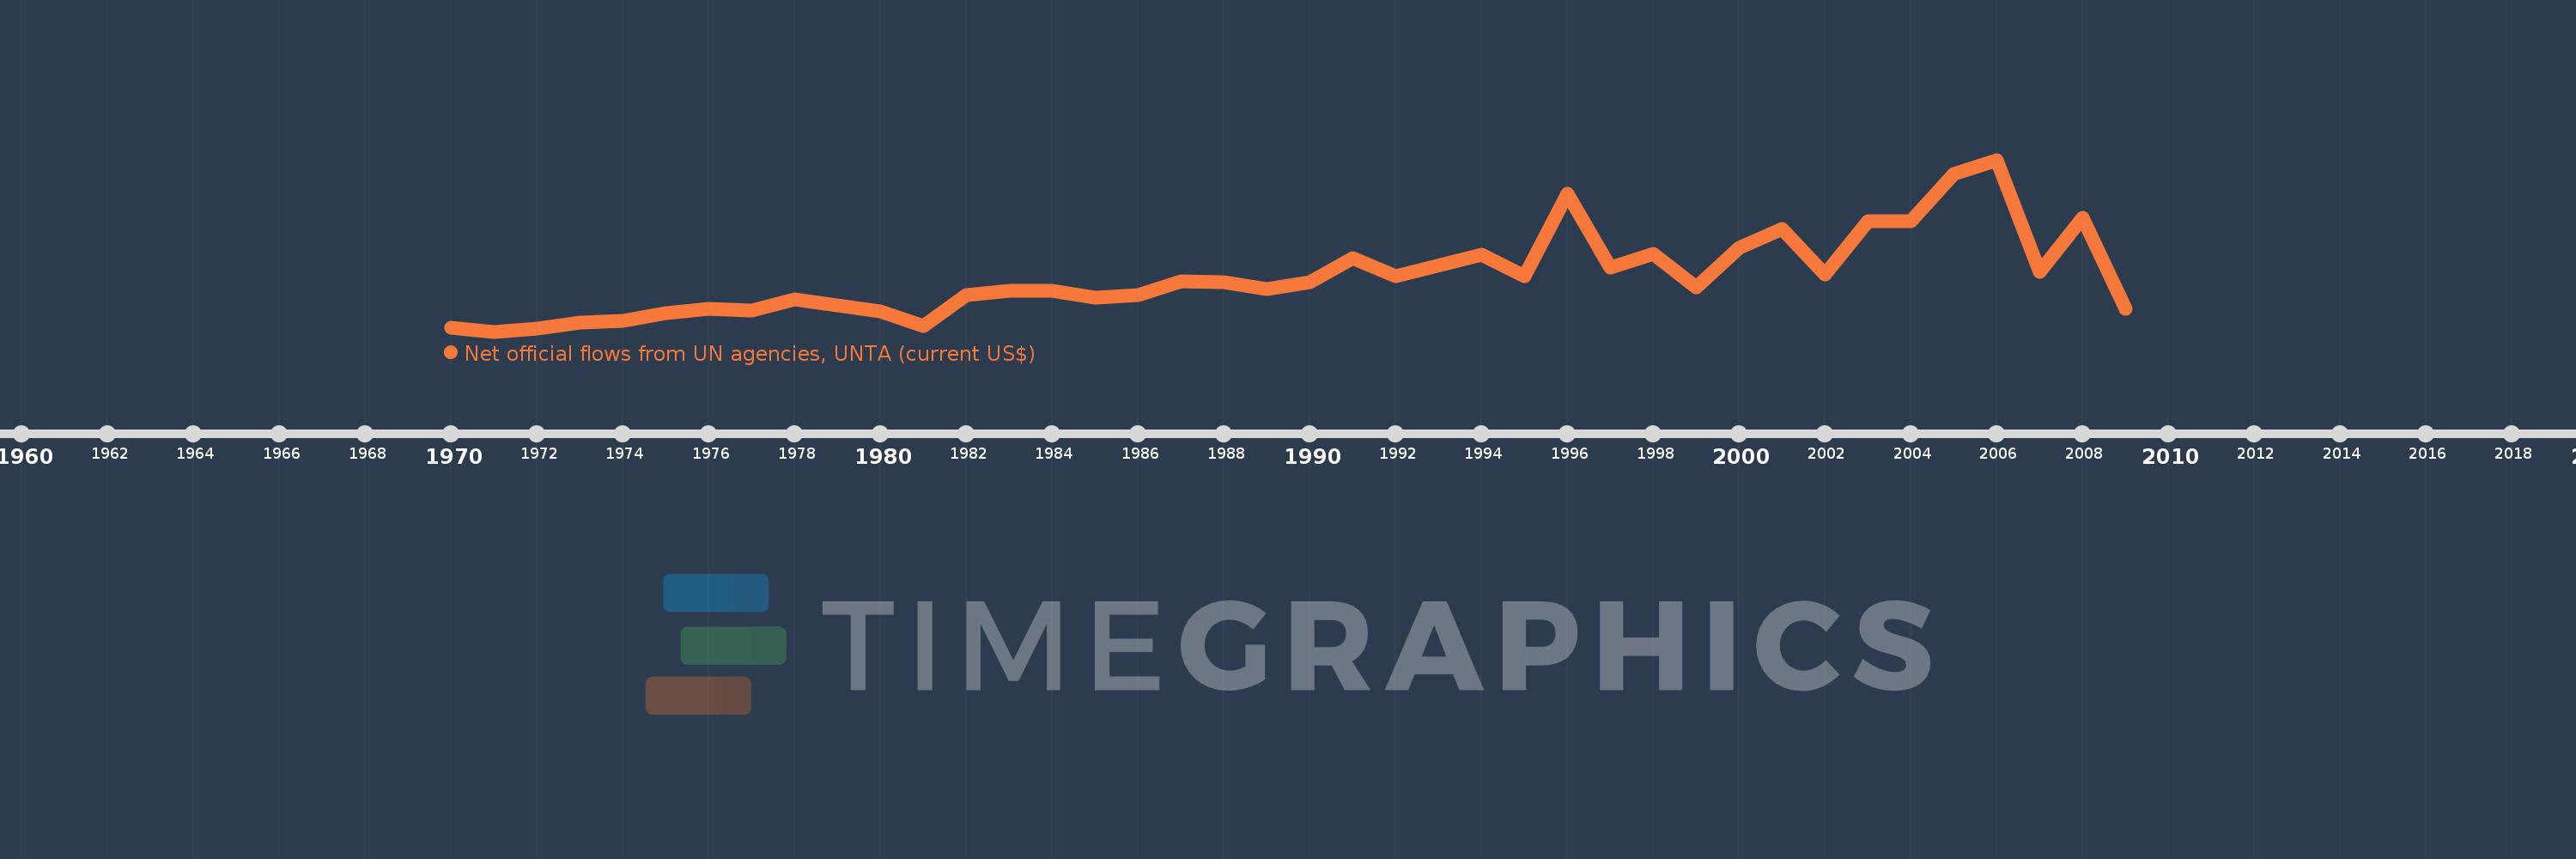
Net official flows from UN agencies, UNTA (current US$)
2009,2008,2007,2006,2005,2004,2003,2002,2001,2000,1999,1998,1997,1996,1995,1994,1992,1991,1990,1989,1988,1987,1986,1985,1984,1983,1982,1981,1980,1979,1978,1977,1976,1975,1974,1973,1972,1971,1970
This statistics in other country:
AfghanistanAlbaniaAlgeriaAngolaAntigua and BarbudaArab WorldArgentinaArmeniaArubaAzerbaijanBahamas, TheBahrainBangladeshBarbadosBelarusBelizeBeninBermudaBhutanBoliviaBosnia and HerzegovinaBotswanaBrazilBritish Virgin IslandsBrunei DarussalamBulgariaBurkina FasoBurundiCabo VerdeCambodiaCameroonCaribbean small statesCayman IslandsCentral African RepublicCentral Europe and the BalticsChadChileChinaColombiaComorosCongo, Dem. Rep.Congo, Rep.Costa RicaCote d'IvoireCroatiaCubaCyprusCzech RepublicDjiboutiDominicaDominican RepublicEast Asia & PacificEast Asia & Pacific (excluding high income)East Asia & Pacific (IDA & IBRD countries)EcuadorEgypt, Arab Rep.El SalvadorEquatorial GuineaEritreaEstoniaEthiopiaEuro areaEurope & Central AsiaEurope & Central Asia (excluding high income)Europe & Central Asia (IDA & IBRD countries)European UnionFijiFragile and conflict affected situationsFrench PolynesiaGabonGambia, TheGeorgiaGhanaGrenadaGuatemalaGuineaGuinea-BissauGuyanaHaitiHeavily indebted poor countries (HIPC)High incomeHondurasHong Kong SAR, ChinaHungaryIBRD onlyIDA & IBRD totalIDA blendIDA onlyIDA totalIndiaIndonesiaIran, Islamic Rep.IraqIsraelJamaicaJordanKazakhstanKenyaKiribatiKorea, Dem. People’s Rep.Korea, Rep.KuwaitKyrgyz RepublicLao PDRLatin America & Caribbean Latin America & Caribbean (excluding high income)Latin America & the Caribbean (IDA & IBRD countries)LatviaLeast developed countries: UN classificationLebanonLesothoLiberiaLibyaLithuaniaLow & middle incomeLow incomeLower middle incomeMacao SAR, ChinaMacedonia, FYRMadagascarMalawiMalaysiaMaldivesMaliMaltaMarshall IslandsMauritaniaMauritiusMexicoMicronesia, Fed. Sts.Middle East & North AfricaMiddle East & North Africa (excluding high income)Middle East & North Africa (IDA & IBRD countries)Middle incomeMoldovaMongoliaMontenegroMoroccoMozambiqueMyanmarNamibiaNauruNepalNew CaledoniaNicaraguaNigerNigeriaNorth AmericaNorthern Mariana IslandsOECD membersOmanOther small statesPacific island small statesPakistanPalauPanamaPapua New GuineaParaguayPeruPhilippinesPolandQatarRomaniaRussian FederationRwandaSamoaSao Tome and PrincipeSaudi ArabiaSenegalSerbiaSeychellesSierra LeoneSingaporeSlovak RepublicSloveniaSmall statesSolomon IslandsSomaliaSouth AfricaSouth AsiaSouth Asia (IDA & IBRD)Sri LankaSt. Kitts and NevisSt. LuciaSt. Vincent and the GrenadinesSub-Saharan Africa Sub-Saharan Africa (excluding high income)Sub-Saharan Africa (IDA & IBRD countries)SudanSurinameSwazilandSyrian Arab RepublicTajikistanTanzaniaThailandTimor-LesteTogoTongaTrinidad and TobagoTunisiaTurkeyTurkmenistanTurks and Caicos IslandsTuvaluUgandaUkraineUnited Arab EmiratesUpper middle incomeUruguayUzbekistanVanuatuVenezuela, RBVietnamWest Bank and GazaWorldYemen, Rep.ZambiaZimbabwe Timeline:
This timeline shows a graph from 1970 to 2009 of Central African Republic. No data until 1969. Number of actual observations by date: 39.
Source name:
World Development Indicators
Source organization:
Development Assistance Committee of the Organisation for Economic Co-operation and Development, Geographical Distribution of Financial Flows to Developing Countries, Development Co-operation Report, and International Development Statistics database. Data are available online at: www.oecd.org/dac/stats/idsonline.
Categories, topics:
Aid Effectiveness
Last updated:
apr 23, 2017
Indicators value changes by year
Maximum:
3.2 mln
jan 1, 2006
At the date of observation
Value
Absolute change
Change from previous value
jan 1, 1970
150.0K
+150.0K
0.0%
jan 1, 1971
80.0K
-70.0K
-46.67%
jan 1, 1972
130.0K
+50.0K
62.5%
jan 1, 1973
250.0K
+120.0K
92.31%
jan 1, 1974
270.0K
+20.0K
8.0%
jan 1, 1975
420.0K
+150.0K
55.56%
jan 1, 1976
490.0K
+70.0K
16.67%
jan 1, 1977
460.0K
-30.0K
-6.12%
jan 1, 1978
660.0K
+200.0K
43.48%
jan 1, 1979
550.0K
-110.0K
-16.67%
jan 1, 1980
440.0K
-110.0K
-20.0%
jan 1, 1981
180.0K
-260.0K
-59.09%
jan 1, 1982
750.0K
+570.0K
316.67%
jan 1, 1983
820.0K
+70.0K
9.33%
jan 1, 1984
820.0K
0.0
0.0%
jan 1, 1985
700.0K
-120.0K
-14.63%
jan 1, 1986
740.0K
+40.0K
5.71%
jan 1, 1987
990.0K
+250.0K
33.78%
jan 1, 1988
970.0K
-20.0K
-2.02%
jan 1, 1989
860.0K
-110.0K
-11.34%
jan 1, 1990
980.0K
+120.0K
13.95%
jan 1, 1991
1.41 mln
+430.0K
43.88%
jan 1, 1992
1.09 mln
-320.0K
-22.7%
jan 1, 1994
1.47 mln
+380.0K
34.86%
jan 1, 1995
1.09 mln
-380.0K
-25.85%
jan 1, 1996
2.58 mln
+1.49 mln
136.7%
jan 1, 1997
1.25 mln
-1.33 mln
-51.55%
jan 1, 1998
1.49 mln
+240.0K
19.2%
jan 1, 1999
880.0K
-610.0K
-40.94%
jan 1, 2000
1.6 mln
+720.0K
81.82%
jan 1, 2001
1.95 mln
+350.0K
21.88%
jan 1, 2002
1.11 mln
-840.0K
-43.08%
jan 1, 2003
2.09 mln
+980.0K
88.29%
jan 1, 2004
2.09 mln
0.0
0.0%
jan 1, 2005
2.95 mln
+860.0K
41.15%
jan 1, 2006
3.2 mln
+250.0K
8.47%
jan 1, 2007
1.16 mln
-2.04 mln
-63.75%
jan 1, 2008
2.14 mln
+980.0K
84.48%
jan 1, 2009
500.0K
-1.64 mln
-76.64%
Ranking of countries by current statistics by years


Comments: