29
/
en
AIzaSyAYiBZKx7MnpbEhh9jyipgxe19OcubqV5w
April 1, 2024
100615
Cameroon
CMR
true
2
1
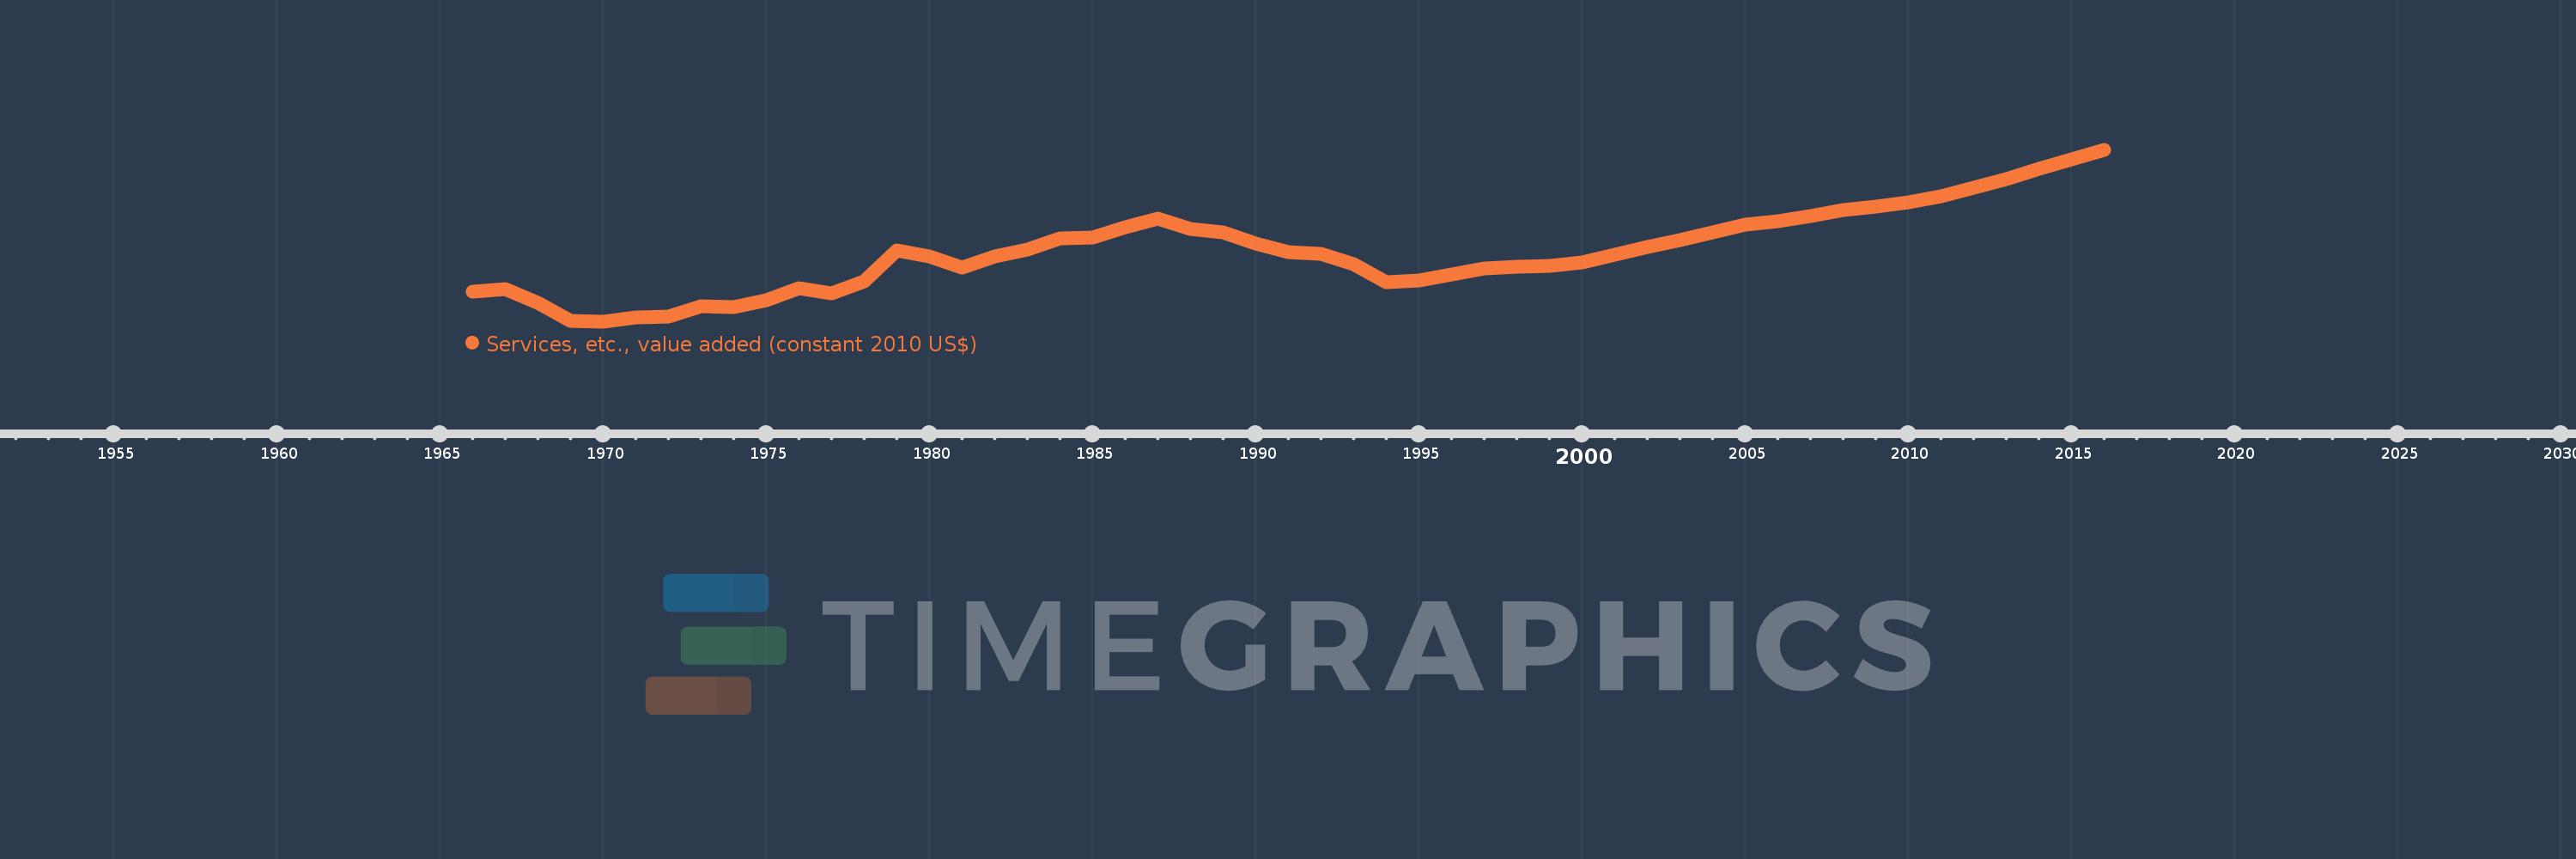
Services, etc., value added (constant 2010 US$)
2016,2015,2014,2013,2012,2011,2010,2009,2008,2007,2006,2005,2004,2003,2002,2001,2000,1999,1998,1997,1996,1995,1994,1993,1992,1991,1990,1989,1988,1987,1986,1985,1984,1983,1982,1981,1980,1979,1978,1977,1976,1975,1974,1973,1972,1971,1970,1969,1968,1967,1966
This statistics in other country:
AfghanistanAlbaniaAlgeriaAndorraAntigua and BarbudaArab WorldArgentinaArmeniaArubaAustraliaAustriaAzerbaijanBahamas, TheBahrainBangladeshBarbadosBelarusBelgiumBelizeBeninBermudaBhutanBoliviaBosnia and HerzegovinaBotswanaBrazilBrunei DarussalamBulgariaBurkina FasoBurundiCabo VerdeCambodiaCameroonCanadaCaribbean small statesCentral African RepublicCentral Europe and the BalticsChadChileChinaColombiaComorosCongo, Dem. Rep.Congo, Rep.Costa RicaCote d'IvoireCroatiaCubaCyprusCzech RepublicDenmarkDominicaDominican RepublicEarly-demographic dividendEast Asia & PacificEast Asia & Pacific (excluding high income)East Asia & Pacific (IDA & IBRD countries)EcuadorEgypt, Arab Rep.El SalvadorEquatorial GuineaEstoniaEthiopiaEuro areaEurope & Central AsiaEurope & Central Asia (excluding high income)Europe & Central Asia (IDA & IBRD countries)European UnionFaroe IslandsFijiFinlandFragile and conflict affected situationsFranceGabonGambia, TheGeorgiaGermanyGhanaGreeceGrenadaGuatemalaGuineaGuinea-BissauGuyanaHeavily indebted poor countries (HIPC)High incomeHondurasHong Kong SAR, ChinaHungaryIBRD onlyIcelandIDA & IBRD totalIDA blendIDA onlyIDA totalIndiaIndonesiaIran, Islamic Rep.IraqIrelandItalyJamaicaJapanJordanKazakhstanKenyaKiribatiKorea, Rep.KosovoKuwaitKyrgyz RepublicLao PDRLate-demographic dividendLatin America & Caribbean Latin America & Caribbean (excluding high income)Latin America & the Caribbean (IDA & IBRD countries)LatviaLeast developed countries: UN classificationLebanonLesothoLiberiaLithuaniaLow & middle incomeLow incomeLower middle incomeLuxembourgMacao SAR, ChinaMacedonia, FYRMadagascarMalawiMalaysiaMaldivesMaliMaltaMarshall IslandsMauritaniaMauritiusMexicoMicronesia, Fed. Sts.Middle East & North AfricaMiddle East & North Africa (excluding high income)Middle East & North Africa (IDA & IBRD countries)Middle incomeMoldovaMongoliaMontenegroMoroccoMozambiqueMyanmarNamibiaNepalNetherlandsNew ZealandNicaraguaNigerNigeriaNorth AmericaNorwayOECD membersOmanOther small statesPacific island small statesPakistanPalauPanamaParaguayPeruPhilippinesPolandPortugalPost-demographic dividendPre-demographic dividendPuerto RicoQatarRomaniaRussian FederationRwandaSamoaSao Tome and PrincipeSaudi ArabiaSenegalSerbiaSeychellesSierra LeoneSingaporeSlovak RepublicSloveniaSmall statesSouth AfricaSouth AsiaSouth Asia (IDA & IBRD)SpainSri LankaSt. Kitts and NevisSt. LuciaSt. Vincent and the GrenadinesSub-Saharan Africa Sub-Saharan Africa (excluding high income)Sub-Saharan Africa (IDA & IBRD countries)SudanSurinameSwazilandSwedenSwitzerlandTajikistanTanzaniaThailandTimor-LesteTogoTongaTrinidad and TobagoTunisiaTurkeyTurkmenistanTuvaluUgandaUkraineUnited Arab EmiratesUnited KingdomUnited StatesUpper middle incomeUruguayUzbekistanVanuatuVenezuela, RBVietnamWest Bank and GazaWorldYemen, Rep.ZambiaZimbabwe Timeline:
This timeline shows a graph from 1966 to 2016 of Cameroon. No data until 1965. Number of actual observations by date: 51.
Source name:
World Development Indicators
Source organization:
World Bank national accounts data, and OECD National Accounts data files.
Categories, topics:
Economy & Growth
Last updated:
apr 23, 2017
Indicators value changes by year
Minimum:
1.638 bln
jan 1, 1970
Maximum:
13.359 bln
jan 1, 2016
At the date of observation
Value
Absolute change
Change from previous value
jan 1, 1966
3.695 bln
+3.695 bln
0.0%
jan 1, 1967
3.872 bln
+176.811 mln
4.78%
jan 1, 1968
2.959 bln
-913.023 mln
-23.58%
jan 1, 1969
1.709 bln
-1.25 bln
-42.25%
jan 1, 1970
1.638 bln
-71.077 mln
-4.16%
jan 1, 1971
1.966 bln
+327.97 mln
20.03%
jan 1, 1972
2.021 bln
+55.56 mln
2.83%
jan 1, 1973
2.694 bln
+672.288 mln
33.26%
jan 1, 1974
2.68 bln
-13.675 mln
-0.51%
jan 1, 1975
3.149 bln
+468.871 mln
17.5%
jan 1, 1976
3.942 bln
+792.864 mln
25.18%
jan 1, 1977
3.573 bln
-368.712 mln
-9.35%
jan 1, 1978
4.421 bln
+848.62 mln
23.75%
jan 1, 1979
6.496 bln
+2.074 bln
46.92%
jan 1, 1980
6.092 bln
-404.207 mln
-6.22%
jan 1, 1981
5.337 bln
-755.057 mln
-12.4%
jan 1, 1982
6.087 bln
+750.451 mln
14.06%
jan 1, 1983
6.575 bln
+488.487 mln
8.03%
jan 1, 1984
7.336 bln
+760.62 mln
11.57%
jan 1, 1985
7.397 bln
+61.291 mln
0.84%
jan 1, 1986
8.082 bln
+684.658 mln
9.26%
jan 1, 1987
8.66 bln
+578.237 mln
7.15%
jan 1, 1988
7.991 bln
-669.426 mln
-7.73%
jan 1, 1989
7.773 bln
-217.828 mln
-2.73%
jan 1, 1990
6.995 bln
-777.992 mln
-10.01%
jan 1, 1991
6.417 bln
-578.12 mln
-8.26%
jan 1, 1992
6.272 bln
-144.642 mln
-2.25%
jan 1, 1993
5.58 bln
-692.706 mln
-11.04%
jan 1, 1994
4.365 bln
-1.215 bln
-21.78%
jan 1, 1995
4.478 bln
+113.219 mln
2.59%
jan 1, 1996
4.895 bln
+417.235 mln
9.32%
jan 1, 1997
5.308 bln
+413.267 mln
8.44%
jan 1, 1998
5.408 bln
+99.218 mln
1.87%
jan 1, 1999
5.482 bln
+74.117 mln
1.37%
jan 1, 2000
5.706 bln
+224.279 mln
4.09%
jan 1, 2001
6.22 bln
+513.869 mln
9.01%
jan 1, 2002
6.747 bln
+527.616 mln
8.48%
jan 1, 2003
7.237 bln
+490.087 mln
7.26%
jan 1, 2004
7.77 bln
+532.91 mln
7.36%
jan 1, 2005
8.286 bln
+515.793 mln
6.64%
jan 1, 2006
8.533 bln
+246.551 mln
2.98%
jan 1, 2007
8.835 bln
+302.421 mln
3.54%
jan 1, 2008
9.277 bln
+441.837 mln
5.0%
jan 1, 2009
9.487 bln
+209.771 mln
2.26%
jan 1, 2010
9.823 bln
+336.053 mln
3.54%
jan 1, 2011
10.215 bln
+391.756 mln
3.99%
jan 1, 2012
10.781 bln
+566.83 mln
5.55%
jan 1, 2013
11.376 bln
+594.339 mln
5.51%
jan 1, 2014
12.066 bln
+690.511 mln
6.07%
jan 1, 2015
12.739 bln
+672.355 mln
5.57%
jan 1, 2016
13.359 bln
+619.951 mln
4.87%
Ranking of countries by current statistics by years


Comments: