29
/
en
AIzaSyAYiBZKx7MnpbEhh9jyipgxe19OcubqV5w
April 1, 2024
100588
Cameroon
CMR
true
2
1
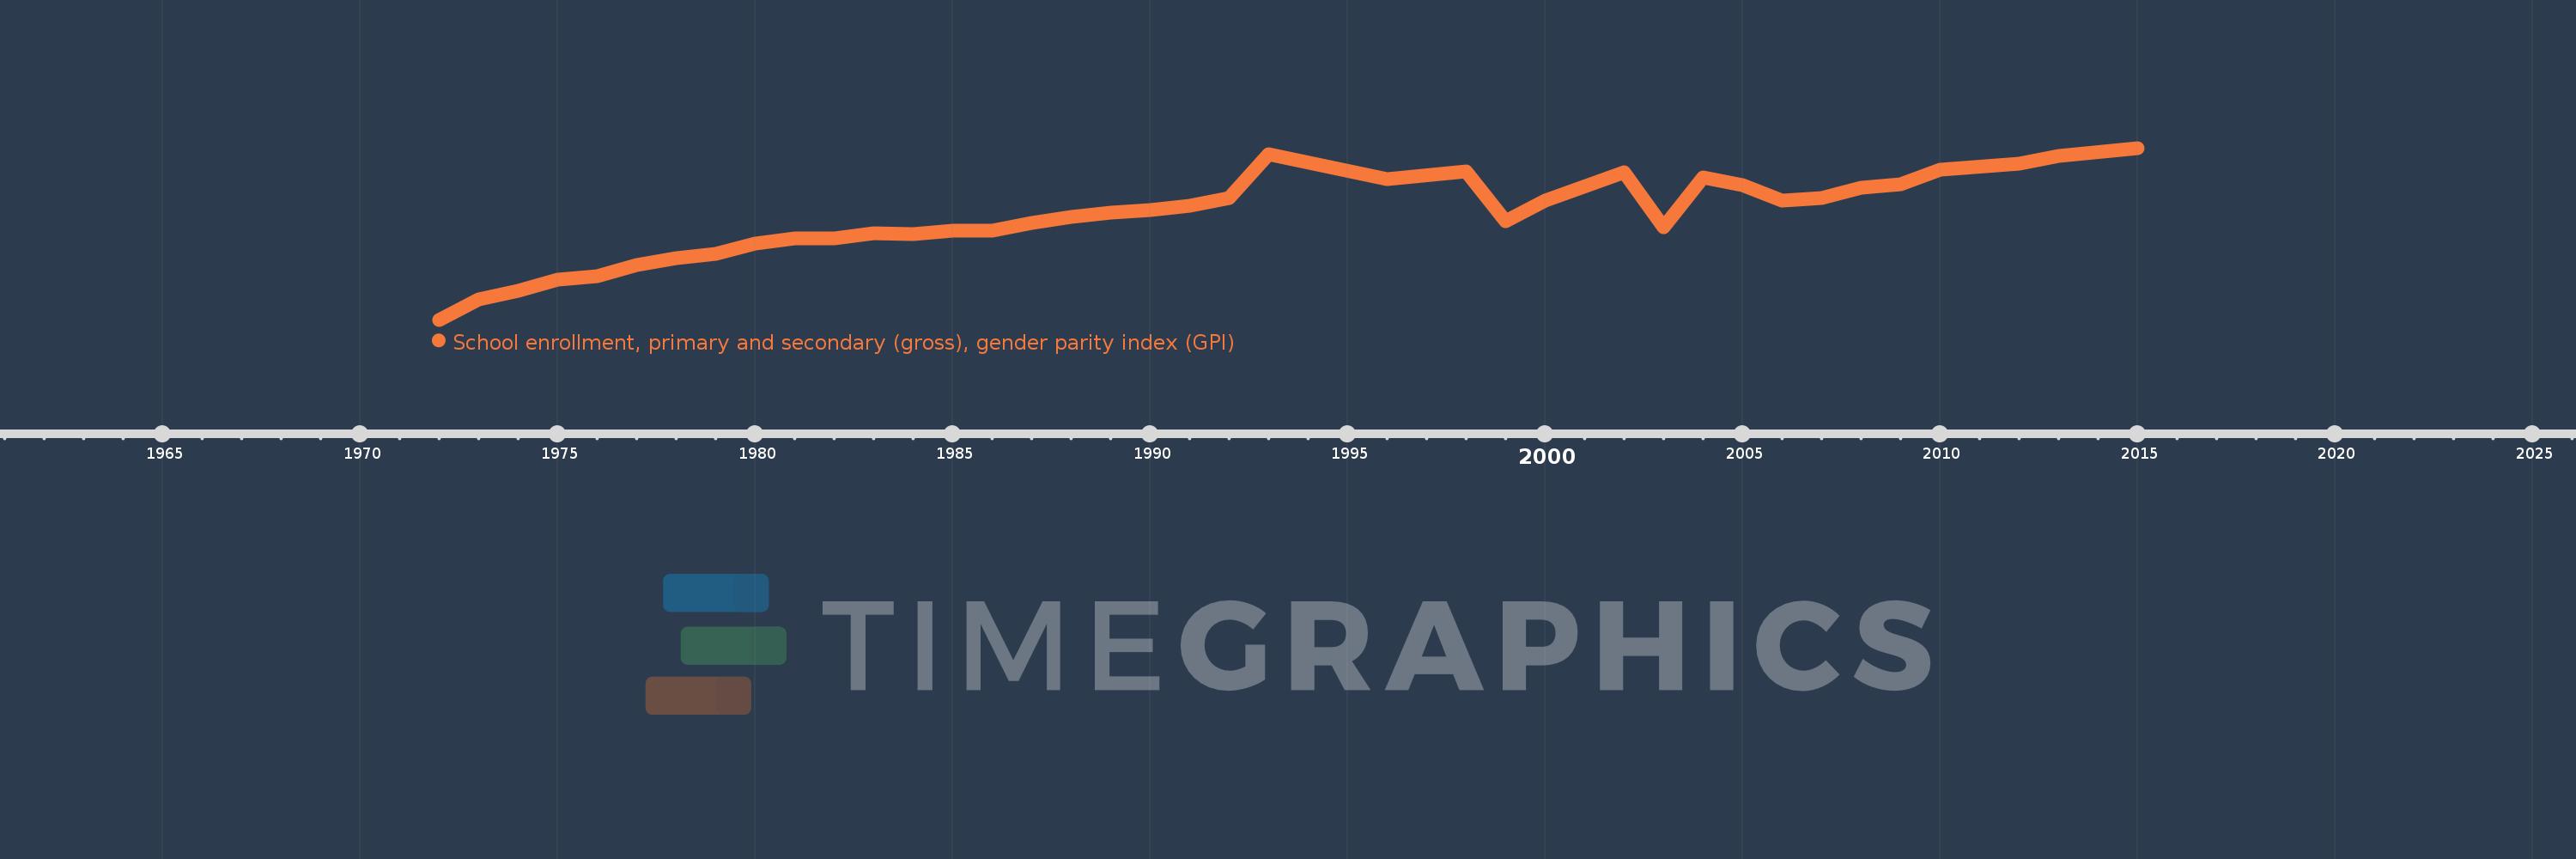
School enrollment, primary and secondary (gross), gender parity index (GPI)
2015,2013,2012,2010,2009,2008,2007,2006,2005,2004,2003,2002,2000,1999,1998,1996,1993,1992,1991,1990,1989,1988,1987,1986,1985,1984,1983,1982,1981,1980,1979,1978,1977,1976,1975,1974,1973,1972
This statistics in other country:
AfghanistanAlbaniaAlgeriaAndorraAngolaAntigua and BarbudaArab WorldArgentinaArmeniaArubaAustraliaAustriaAzerbaijanBahamas, TheBahrainBangladeshBarbadosBelarusBelgiumBelizeBeninBermudaBhutanBoliviaBosnia and HerzegovinaBotswanaBrazilBrunei DarussalamBulgariaBurkina FasoBurundiCabo VerdeCambodiaCameroonCanadaCaribbean small statesCentral African RepublicCentral Europe and the BalticsChadChileChinaColombiaComorosCongo, Dem. Rep.Congo, Rep.Costa RicaCote d'IvoireCroatiaCubaCuracaoCyprusCzech RepublicDenmarkDjiboutiDominicaDominican RepublicEarly-demographic dividendEast Asia & PacificEast Asia & Pacific (excluding high income)East Asia & Pacific (IDA & IBRD countries)EcuadorEgypt, Arab Rep.El SalvadorEquatorial GuineaEritreaEstoniaEthiopiaEuro areaEurope & Central AsiaEurope & Central Asia (excluding high income)Europe & Central Asia (IDA & IBRD countries)European UnionFijiFinlandFragile and conflict affected situationsFranceGabonGambia, TheGeorgiaGermanyGhanaGreeceGrenadaGuatemalaGuineaGuinea-BissauGuyanaHeavily indebted poor countries (HIPC)High incomeHondurasHong Kong SAR, ChinaHungaryIBRD onlyIcelandIDA & IBRD totalIDA blendIDA onlyIDA totalIndiaIndonesiaIran, Islamic Rep.IraqIrelandIsraelItalyJamaicaJapanJordanKazakhstanKenyaKiribatiKorea, Dem. People’s Rep.Korea, Rep.KuwaitKyrgyz RepublicLao PDRLate-demographic dividendLatin America & Caribbean Latin America & Caribbean (excluding high income)Latin America & the Caribbean (IDA & IBRD countries)LatviaLeast developed countries: UN classificationLebanonLesothoLiberiaLibyaLiechtensteinLithuaniaLow & middle incomeLow incomeLower middle incomeLuxembourgMacao SAR, ChinaMacedonia, FYRMadagascarMalawiMaldivesMaliMaltaMarshall IslandsMauritaniaMauritiusMexicoMicronesia, Fed. Sts.Middle East & North AfricaMiddle East & North Africa (excluding high income)Middle East & North Africa (IDA & IBRD countries)Middle incomeMoldovaMongoliaMontenegroMoroccoMozambiqueMyanmarNamibiaNauruNepalNetherlandsNew ZealandNicaraguaNigerNigeriaNorth AmericaNorwayOECD membersOmanOther small statesPacific island small statesPakistanPalauPanamaPapua New GuineaParaguayPeruPhilippinesPolandPortugalPost-demographic dividendPre-demographic dividendPuerto RicoQatarRomaniaRussian FederationRwandaSamoaSan MarinoSao Tome and PrincipeSaudi ArabiaSenegalSerbiaSeychellesSierra LeoneSlovak RepublicSloveniaSmall statesSolomon IslandsSomaliaSouth AfricaSouth AsiaSouth Asia (IDA & IBRD)SpainSri LankaSt. Kitts and NevisSt. LuciaSt. Vincent and the GrenadinesSub-Saharan Africa Sub-Saharan Africa (excluding high income)Sub-Saharan Africa (IDA & IBRD countries)SudanSurinameSwazilandSwedenSwitzerlandSyrian Arab RepublicTajikistanTanzaniaThailandTimor-LesteTogoTongaTrinidad and TobagoTunisiaTurkeyTurkmenistanTuvaluUgandaUkraineUnited Arab EmiratesUnited KingdomUnited StatesUpper middle incomeUruguayUzbekistanVanuatuVenezuela, RBVietnamWest Bank and GazaWorldYemen, Rep.ZambiaZimbabwe Timeline:
This timeline shows a graph from 1972 to 2015 of Cameroon. No data until 1971. Number of actual observations by date: 38.
Source name:
World Development Indicators
Source organization:
United Nations Educational, Scientific, and Cultural Organization (UNESCO) Institute for Statistics.
Categories, topics:
Aid Effectiveness, Climate Change, Education, Gender, Social Development
Last updated:
apr 23, 2017
Indicators value changes by year
At the date of observation
Value
Absolute change
Change from previous value
jan 1, 1972
0.71
+0.71
0.0%
jan 1, 1973
0.73
+0.02
2.86%
jan 1, 1974
0.738
+0.008
1.03%
jan 1, 1975
0.749
+0.011
1.48%
jan 1, 1976
0.752
+0.003
0.35%
jan 1, 1977
0.763
+0.011
1.47%
jan 1, 1978
0.77
+0.008
1.02%
jan 1, 1979
0.774
+0.004
0.46%
jan 1, 1980
0.784
+0.01
1.34%
jan 1, 1981
0.789
+0.005
0.65%
jan 1, 1982
0.789
0.0
-0.04%
jan 1, 1983
0.794
+0.005
0.63%
jan 1, 1984
0.793
-0.001
-0.08%
jan 1, 1985
0.797
+0.003
0.42%
jan 1, 1986
0.797
+0.001
0.11%
jan 1, 1987
0.804
+0.006
0.76%
jan 1, 1988
0.81
+0.006
0.77%
jan 1, 1989
0.814
+0.004
0.5%
jan 1, 1990
0.817
+0.003
0.38%
jan 1, 1991
0.821
+0.004
0.55%
jan 1, 1992
0.828
+0.007
0.82%
jan 1, 1993
0.871
+0.043
5.19%
jan 1, 1996
0.847
-0.024
-2.8%
jan 1, 1998
0.854
+0.007
0.83%
jan 1, 1999
0.806
-0.048
-5.63%
jan 1, 2000
0.826
+0.02
2.5%
jan 1, 2002
0.853
+0.027
3.29%
jan 1, 2003
0.8
-0.053
-6.21%
jan 1, 2004
0.848
+0.048
5.94%
jan 1, 2005
0.841
-0.007
-0.82%
jan 1, 2006
0.826
-0.015
-1.73%
jan 1, 2007
0.828
+0.002
0.2%
jan 1, 2008
0.838
+0.01
1.2%
jan 1, 2009
0.842
+0.005
0.56%
jan 1, 2010
0.856
+0.014
1.63%
jan 1, 2012
0.862
+0.005
0.62%
jan 1, 2013
0.869
+0.008
0.9%
jan 1, 2015
0.877
+0.007
0.85%
Ranking of countries by current statistics by years


Comments: