29
/
en
AIzaSyAYiBZKx7MnpbEhh9jyipgxe19OcubqV5w
April 1, 2024
100408
Cameroon
CMR
true
2
1
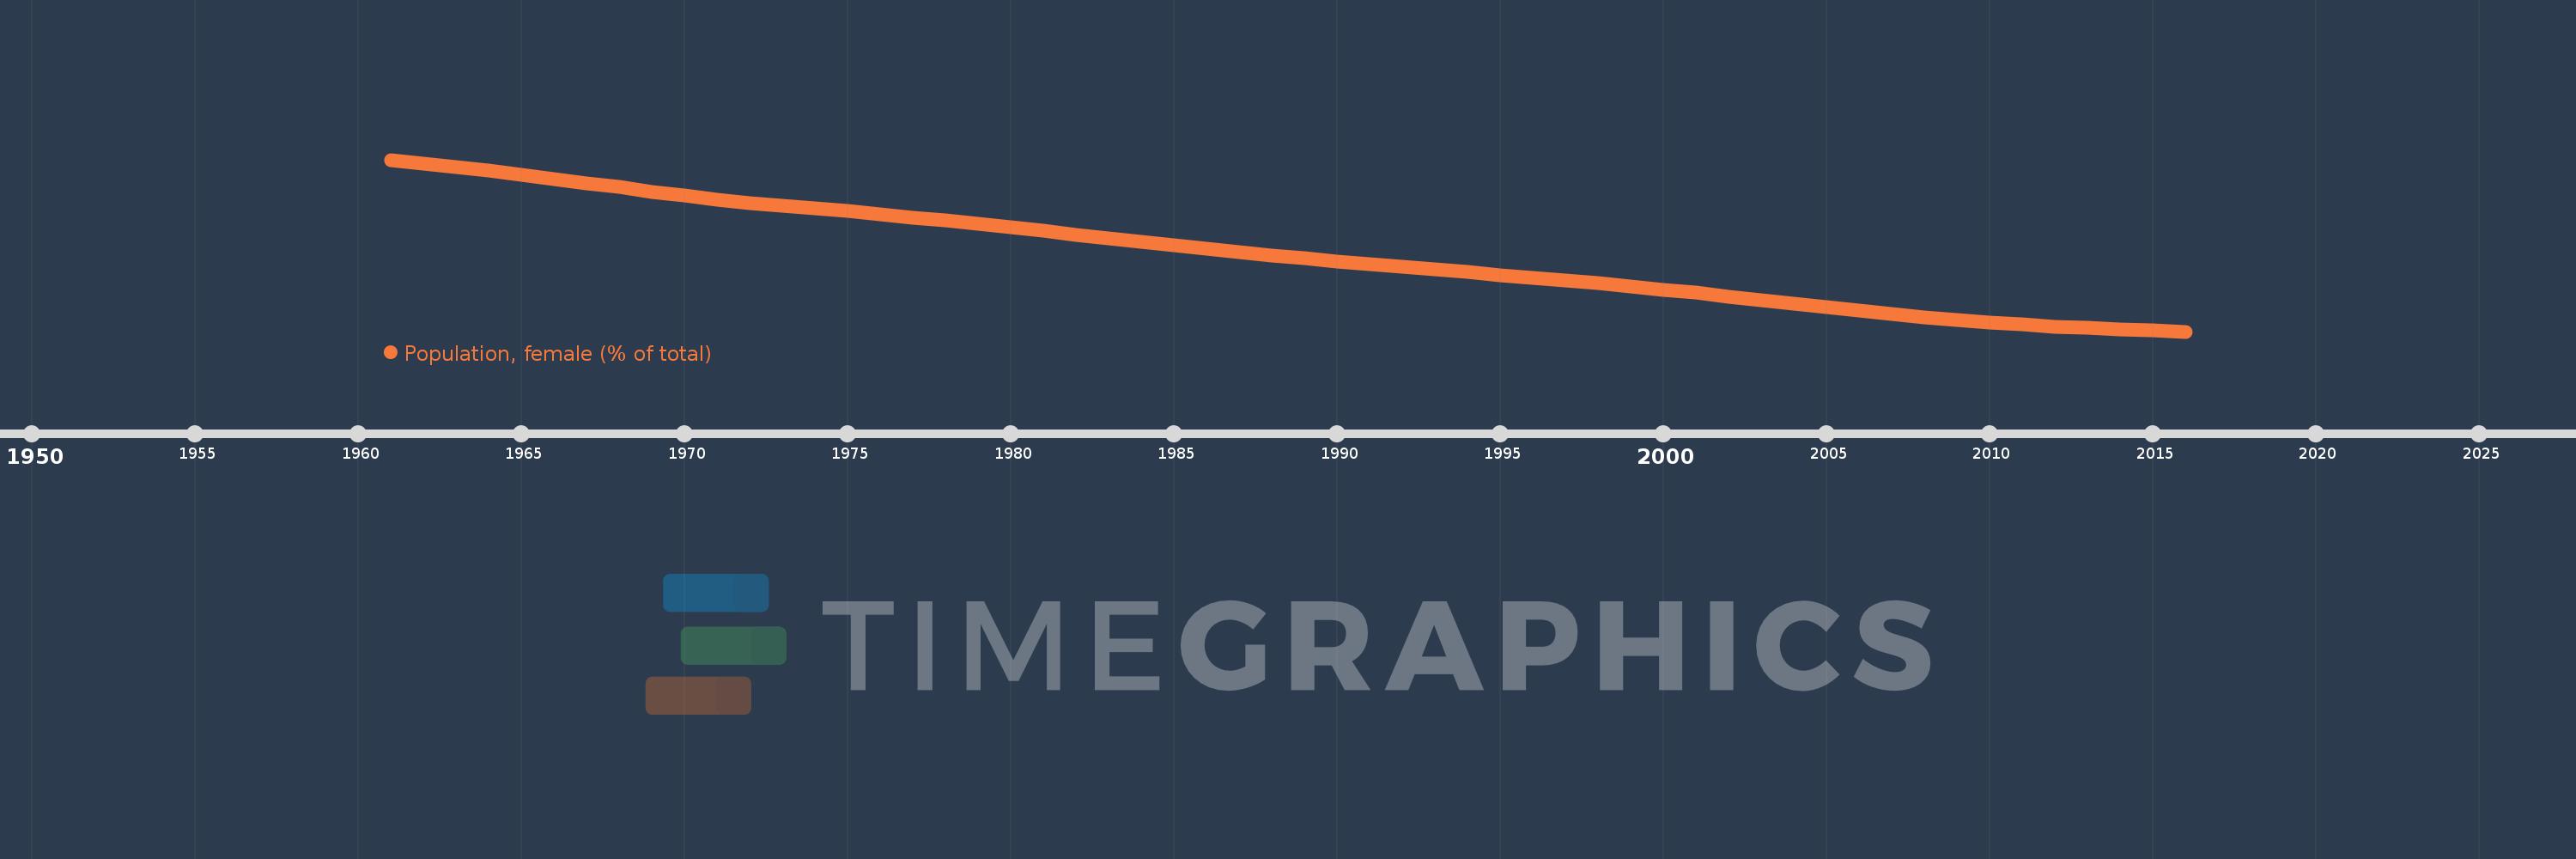
Population, female (% of total)
2016,2015,2014,2013,2012,2011,2010,2009,2008,2007,2006,2005,2004,2003,2002,2001,2000,1999,1998,1997,1996,1995,1994,1993,1992,1991,1990,1989,1988,1987,1986,1985,1984,1983,1982,1981,1980,1979,1978,1977,1976,1975,1974,1973,1972,1971,1970,1969,1968,1967,1966,1965,1964,1963,1962,1961
This statistics in other country:
AfghanistanAlbaniaAlgeriaAngolaAntigua and BarbudaArab WorldArgentinaArmeniaArubaAustraliaAustriaAzerbaijanBahamas, TheBahrainBangladeshBarbadosBelarusBelgiumBelizeBeninBhutanBoliviaBosnia and HerzegovinaBotswanaBrazilBrunei DarussalamBulgariaBurkina FasoBurundiCabo VerdeCambodiaCameroonCanadaCaribbean small statesCentral African RepublicCentral Europe and the BalticsChadChannel IslandsChileChinaColombiaComorosCongo, Dem. Rep.Congo, Rep.Costa RicaCote d'IvoireCroatiaCubaCuracaoCyprusCzech RepublicDenmarkDjiboutiDominican RepublicEarly-demographic dividendEast Asia & PacificEast Asia & Pacific (excluding high income)East Asia & Pacific (IDA & IBRD countries)EcuadorEgypt, Arab Rep.El SalvadorEquatorial GuineaEritreaEstoniaEthiopiaEuro areaEurope & Central AsiaEurope & Central Asia (excluding high income)Europe & Central Asia (IDA & IBRD countries)European UnionFijiFinlandFragile and conflict affected situationsFranceFrench PolynesiaGabonGambia, TheGeorgiaGermanyGhanaGreeceGrenadaGuamGuatemalaGuineaGuinea-BissauGuyanaHaitiHeavily indebted poor countries (HIPC)High incomeHondurasHong Kong SAR, ChinaHungaryIBRD onlyIcelandIDA & IBRD totalIDA blendIDA onlyIDA totalIndiaIndonesiaIran, Islamic Rep.IraqIrelandIsraelItalyJamaicaJapanJordanKazakhstanKenyaKiribatiKorea, Dem. People’s Rep.Korea, Rep.KosovoKuwaitKyrgyz RepublicLao PDRLate-demographic dividendLatin America & Caribbean Latin America & Caribbean (excluding high income)Latin America & the Caribbean (IDA & IBRD countries)LatviaLeast developed countries: UN classificationLebanonLesothoLiberiaLibyaLithuaniaLow & middle incomeLow incomeLower middle incomeLuxembourgMacao SAR, ChinaMacedonia, FYRMadagascarMalawiMalaysiaMaldivesMaliMaltaMauritaniaMauritiusMexicoMicronesia, Fed. Sts.Middle East & North AfricaMiddle East & North Africa (excluding high income)Middle East & North Africa (IDA & IBRD countries)Middle incomeMoldovaMongoliaMontenegroMoroccoMozambiqueMyanmarNamibiaNepalNetherlandsNew CaledoniaNew ZealandNicaraguaNigerNigeriaNorth AmericaNorwayOECD membersOmanOther small statesPacific island small statesPakistanPanamaPapua New GuineaParaguayPeruPhilippinesPolandPortugalPost-demographic dividendPre-demographic dividendPuerto RicoQatarRomaniaRussian FederationRwandaSamoaSao Tome and PrincipeSaudi ArabiaSenegalSerbiaSeychellesSierra LeoneSingaporeSlovak RepublicSloveniaSmall statesSolomon IslandsSomaliaSouth AfricaSouth AsiaSouth Asia (IDA & IBRD)South SudanSpainSri LankaSt. LuciaSt. Vincent and the GrenadinesSub-Saharan Africa Sub-Saharan Africa (excluding high income)Sub-Saharan Africa (IDA & IBRD countries)SudanSurinameSwazilandSwedenSwitzerlandSyrian Arab RepublicTajikistanTanzaniaThailandTimor-LesteTogoTongaTrinidad and TobagoTunisiaTurkeyTurkmenistanUgandaUkraineUnited Arab EmiratesUnited KingdomUnited StatesUpper middle incomeUruguayUzbekistanVanuatuVenezuela, RBVietnamVirgin Islands (U.S.)West Bank and GazaWorldYemen, Rep.ZambiaZimbabwe Timeline:
This timeline shows a graph from 1961 to 2016 of Cameroon. No data until 1960. Number of actual observations by date: 56.
Source name:
World Development Indicators
Source organization:
World Bank staff estimates based on male/female distributions of United Nations Population Division's World Population Prospects.
Categories, topics:
Health
Last updated:
apr 23, 2017
Indicators value changes by year
Minimum:
49.999
jan 1, 2016
Maximum:
50.843
jan 1, 1961
At the date of observation
Value
Absolute change
Change from previous value
jan 1, 1961
50.843
+50.843
0.0%
jan 1, 1962
50.825
-0.017
-0.03%
jan 1, 1963
50.807
-0.018
-0.04%
jan 1, 1964
50.789
-0.019
-0.04%
jan 1, 1965
50.77
-0.019
-0.04%
jan 1, 1966
50.75
-0.02
-0.04%
jan 1, 1967
50.729
-0.021
-0.04%
jan 1, 1968
50.708
-0.021
-0.04%
jan 1, 1969
50.686
-0.021
-0.04%
jan 1, 1970
50.667
-0.02
-0.04%
jan 1, 1971
50.648
-0.018
-0.04%
jan 1, 1972
50.632
-0.016
-0.03%
jan 1, 1973
50.618
-0.015
-0.03%
jan 1, 1974
50.604
-0.014
-0.03%
jan 1, 1975
50.59
-0.014
-0.03%
jan 1, 1976
50.575
-0.015
-0.03%
jan 1, 1977
50.56
-0.015
-0.03%
jan 1, 1978
50.544
-0.016
-0.03%
jan 1, 1979
50.527
-0.017
-0.03%
jan 1, 1980
50.51
-0.017
-0.03%
jan 1, 1981
50.493
-0.017
-0.03%
jan 1, 1982
50.475
-0.018
-0.04%
jan 1, 1983
50.457
-0.018
-0.04%
jan 1, 1984
50.439
-0.018
-0.04%
jan 1, 1985
50.422
-0.017
-0.03%
jan 1, 1986
50.405
-0.017
-0.03%
jan 1, 1987
50.389
-0.016
-0.03%
jan 1, 1988
50.374
-0.015
-0.03%
jan 1, 1989
50.359
-0.015
-0.03%
jan 1, 1990
50.345
-0.014
-0.03%
jan 1, 1991
50.331
-0.014
-0.03%
jan 1, 1992
50.317
-0.014
-0.03%
jan 1, 1993
50.304
-0.013
-0.03%
jan 1, 1994
50.291
-0.013
-0.03%
jan 1, 1995
50.277
-0.013
-0.03%
jan 1, 1996
50.264
-0.014
-0.03%
jan 1, 1997
50.25
-0.014
-0.03%
jan 1, 1998
50.236
-0.014
-0.03%
jan 1, 1999
50.221
-0.015
-0.03%
jan 1, 2000
50.205
-0.016
-0.03%
jan 1, 2001
50.189
-0.016
-0.03%
jan 1, 2002
50.172
-0.017
-0.03%
jan 1, 2003
50.153
-0.018
-0.04%
jan 1, 2004
50.135
-0.018
-0.04%
jan 1, 2005
50.118
-0.018
-0.04%
jan 1, 2006
50.101
-0.017
-0.03%
jan 1, 2007
50.085
-0.016
-0.03%
jan 1, 2008
50.07
-0.015
-0.03%
jan 1, 2009
50.056
-0.014
-0.03%
jan 1, 2010
50.044
-0.012
-0.02%
jan 1, 2011
50.033
-0.011
-0.02%
jan 1, 2012
50.024
-0.009
-0.02%
jan 1, 2013
50.017
-0.007
-0.01%
jan 1, 2014
50.011
-0.006
-0.01%
jan 1, 2015
50.005
-0.006
-0.01%
jan 1, 2016
49.999
-0.006
-0.01%
Ranking of countries by current statistics by years


Comments: